
Figure 4.
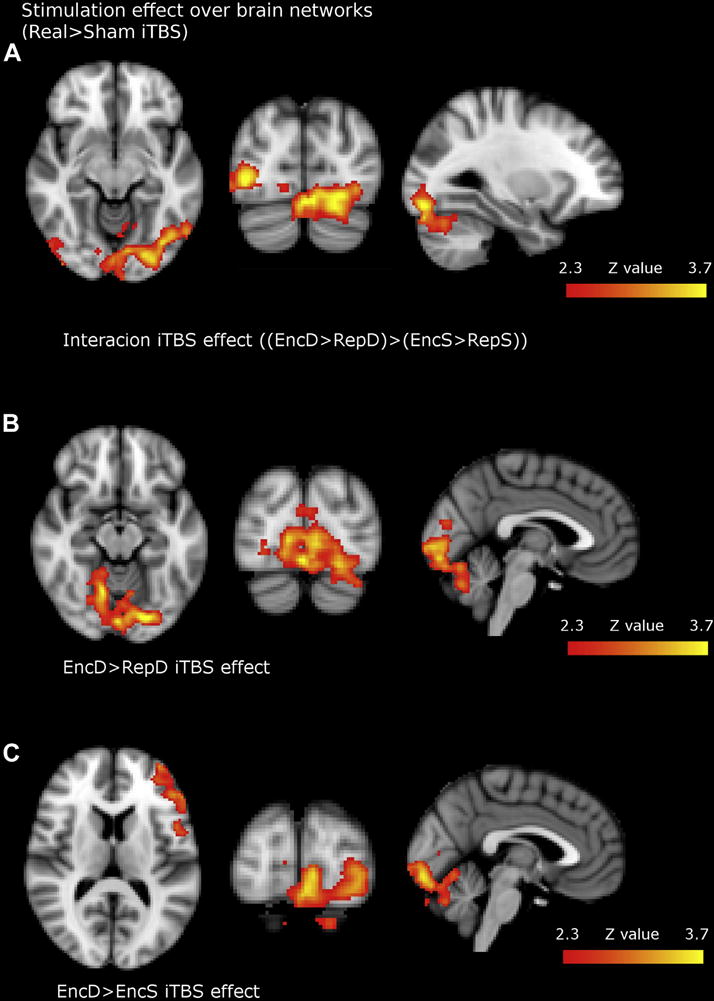
Brain regions where iTBS effects (Time*Group interaction) were found after unpaired two sample t-tests. All contrasts showed increased BOLD activity of real compared to sham group. Figure 4a) showed increased activity for Interaction (Memory*LoP) first-level contrast, namely increased activity specifically for deep encoding. Figure 4b) and 4c) represents increased activity after real iTBS for EncD>RepD and EncD>EncS task contrasts respectively (images shown in radiological convention). For precise anatomical localizations see table 4.