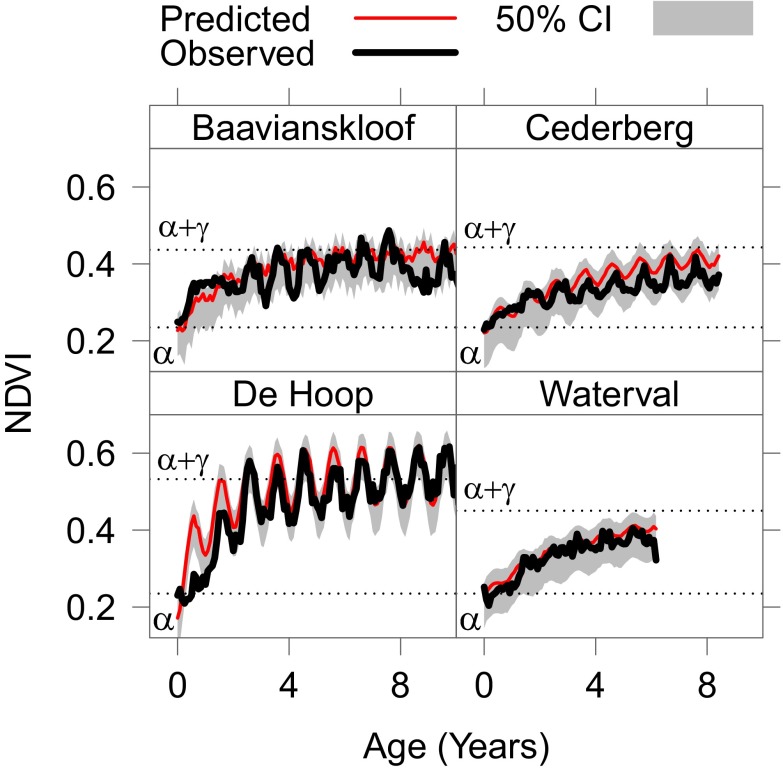
Fig. 1.
Predicted and observed postfire recoveries for four regions across the CFR (see Fig. S1 for locations). The heavy black lines are the mean observed NDVI values for all validation pixels from a single fire in each region. The red lines represent the mean predicted value (Eq. 3). The horizontal dotted lines illustrate the estimated initial (α) and upper asymptote () of postfire NDVI. The shaded areas represent the 50% highest posterior density (HPD) credible intervals (CIs) of the predicted values. Note that the predicted values were estimated using the fitted model (Table S1) and environmental data for each validation pixel as specified in the model and not fit directly to the observed data plotted here.

