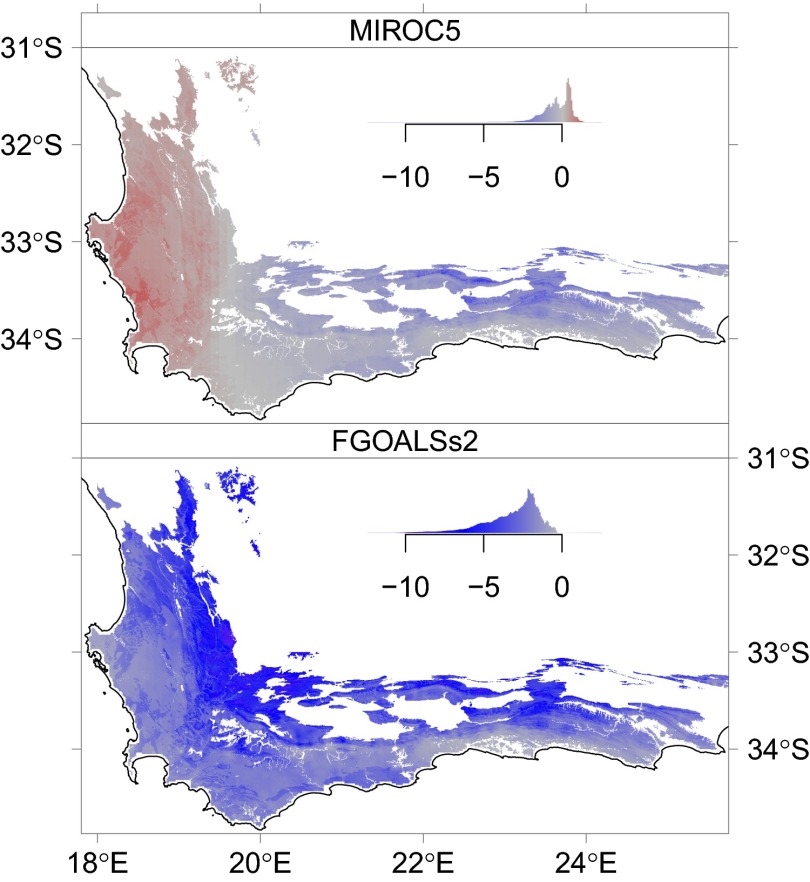
Fig. 3.
Median posterior value of predicted change in recovery time (years) under two downscaled CMIP5 general circulation models (FGOALSs2 and MIROC5) with scenario RCP8.5 averaged over 2080–2100. Negative values indicate faster postfire recovery, whereas positive values indicate slower recovery. See Fig. S5 for all 11 models.

