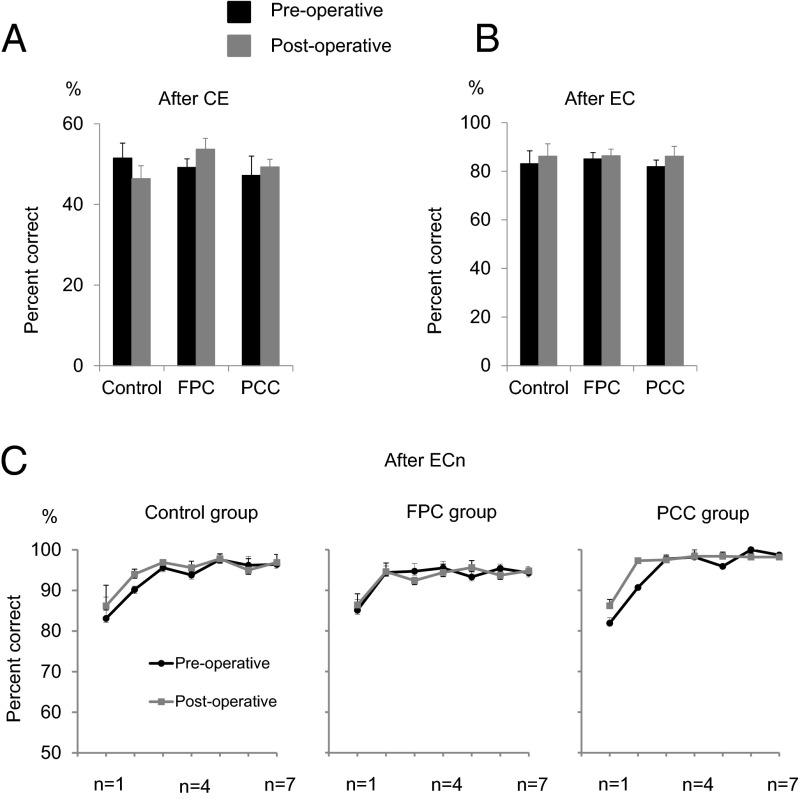
Fig. 5.
Comparable degrees of learning from the behavioral outcomes (rewards to correct responses and no rewards and error signals to erroneous responses) in Control, FPC, and PCC groups. (A) Mean preoperative (black bars) and postoperative (gray bars) percentages of correct responses in the trials immediately after a sequence of correct and error trials (after CE). (B) Mean percentages of correct responses in the trials immediately after an EC trial sequence (after EC). (C) Mean preoperative (black lines) and postoperative (gray lines) percentages of correct responses in the trials immediately after a sequence of n consecutive correct trials after an error trial (after ECn). The data at n = 1 are identical to those in B (SI Results).

