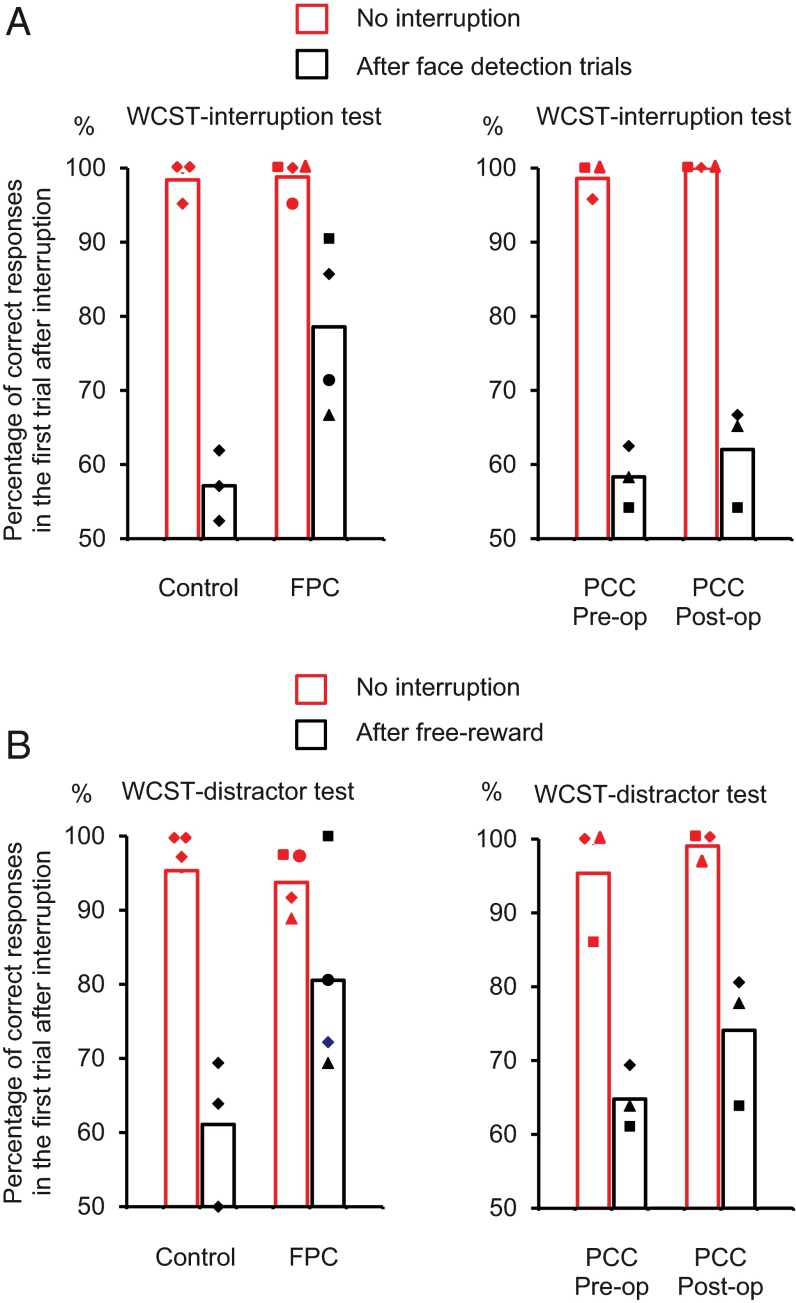
Fig. 7.
The performance of monkeys in control, FPC, and PCC groups in (A) WCST interruption and (B) WCST distractor tests. (A) Black bars show percentages of correct responses in the first trial of WCST analog after interruption by two face detection trials. Red bars indicate percentages of correct responses in the same context but without interruption by face detection trials. (B) The same as in A but with the interruption by two free rewards. The markers for individual data points indicate the monkeys (Figs. 2 and 3) from which the data were obtained: ●, FPC1; ▲, FPC2; ■, FPC3; and ◆, FPC4 for the FPC group and ■, PCC1; ◆, PCC2; and ▲, PCC3 for the PCC group (Fig. S2).

