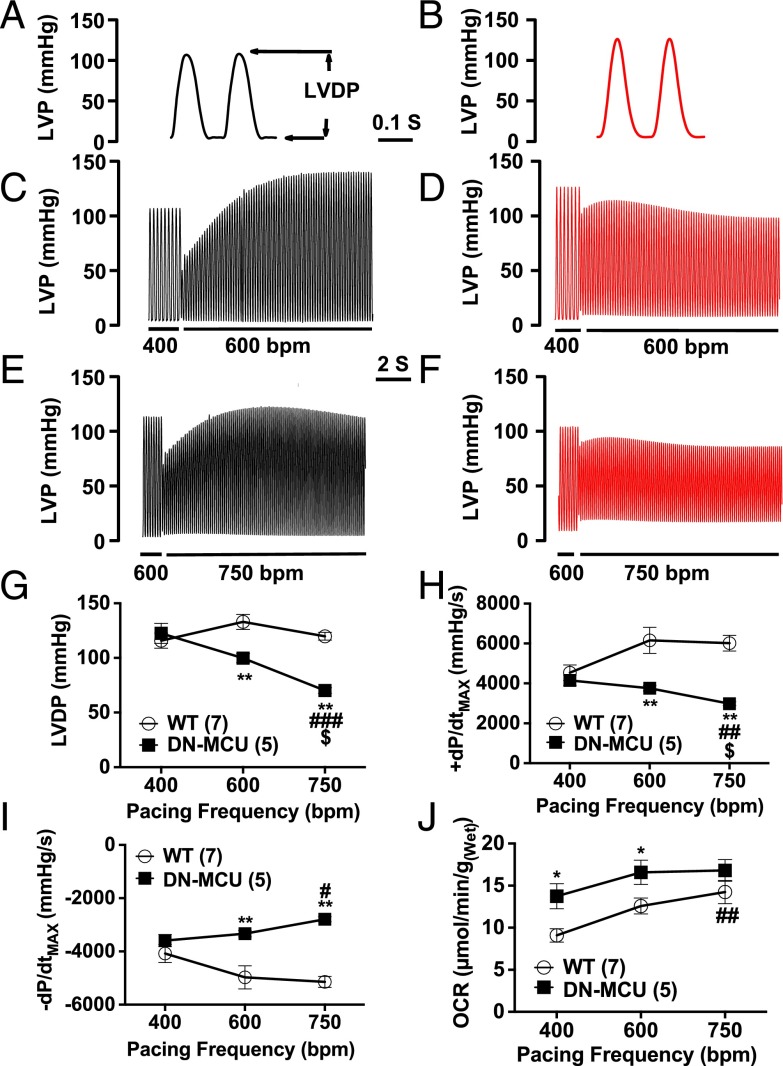
Fig. 2.
DN-MCU expression reduced left ventricular pressure responses to pacing. (A and B) Representative waveform of left ventricular pressure (LVP) (mmHg) in WT and DN-MCU at 400 bpm, respectively. LVDP indicated by arrows. (C and D) Representative LVP changes in WT and DN-MCU hearts when increasing pacing rate from 400 to 600 bpm. (E and F) Representative LVP changes in WT and DN-MCU hearts when increasing pacing rate from 600 to 750 bpm. (G) LVDP (mmHg) at 400, 600, and 750 bpm. (H) +dP/dtMAX (mmHg/s) at 400, 600, and 700 bpm. (I) −dP/dtMAX (mmHg/s) at 400, 600, and 700 bpm. (J) OCR [μmol/min/g(Wet)] in WT and DN-MCU hearts. All error bars represent SEM. Sample size (n) indicated for each group in parentheses. *P < 0.05, **P < 0.01, Student’s t test. #P < 0.05, ##P < 0.01, and ###P < 0.001 comparing 750 to 400 bpm; $P < 0.05 comparing 750 to 600 bpm, Tukey’s post hoc multiple comparison test.

