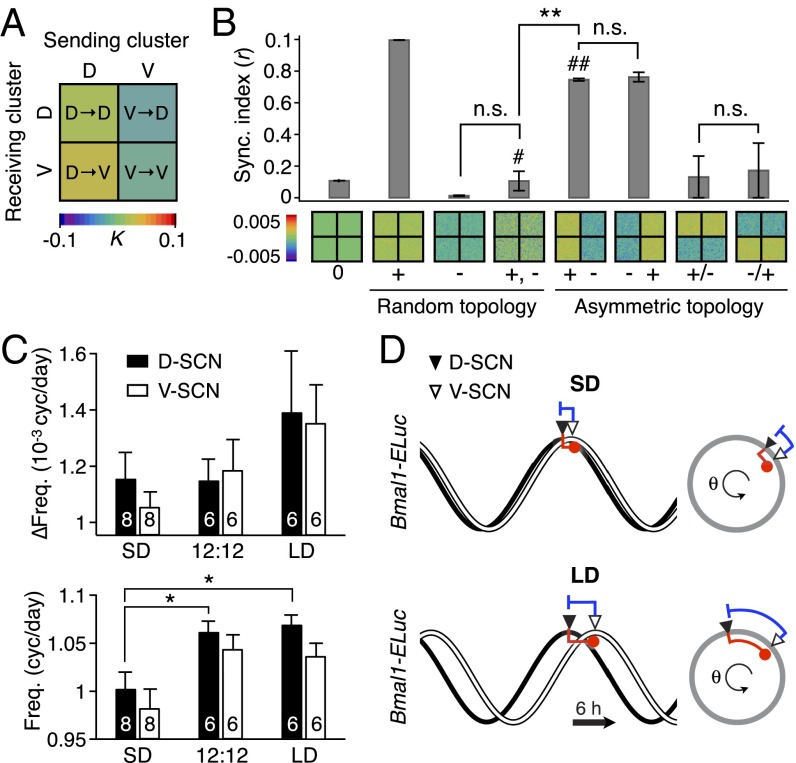
Fig. 2.
Dynamics of SCN oscillators imply asymmetrically distributed repulsive and attractive phase couplings. (A) The phase-model–based estimation of coupling finds a network motif of phase-repulsive coupling (blue) from V- to D-SCN and phase-attractive coupling (red) from D- to V-SCN in the cross-sample mean (SEM ≤0.002, n = 6 12:12 SCNs). (B) Surrogate models under various coupling schemes show that partial synchronization emerges under the asymmetric attractive (+)–repulsive (−) coupling motif (marked with ##) found in A, whereas desynchronization ensues under a randomly distributed, structureless (marked with #) 50:50 mixture of attractive and repulsive couplings (**P < 0.001, Student’s t test for triplicates; details in SI Appendix, Fig. S3). The synchronization index (order parameter, r) measures the degree of synchronization at simulated day 30 (0 for complete desynchronization and 1 for complete synchronization). (C) Estimated shifts in the intrinsic frequency due to the coupling effects (Upper) and average intrinsic frequency in each subregion (Lower). (*P < 0.05, Student’s t test; number of explants indicated on the bar graph.) Note an increasing trend of the coupling contribution by day length in the D-SCN. (D) A two-oscillator phase model explains the day length-modulated phase gap (Fig. 1A) with an asymmetric “push” from V- and “pull” from D-SCN as a consequence of the coupling modulation, which can be explained by both coupling strength and intrinsic frequency (SI Appendix, Fig. S4).

