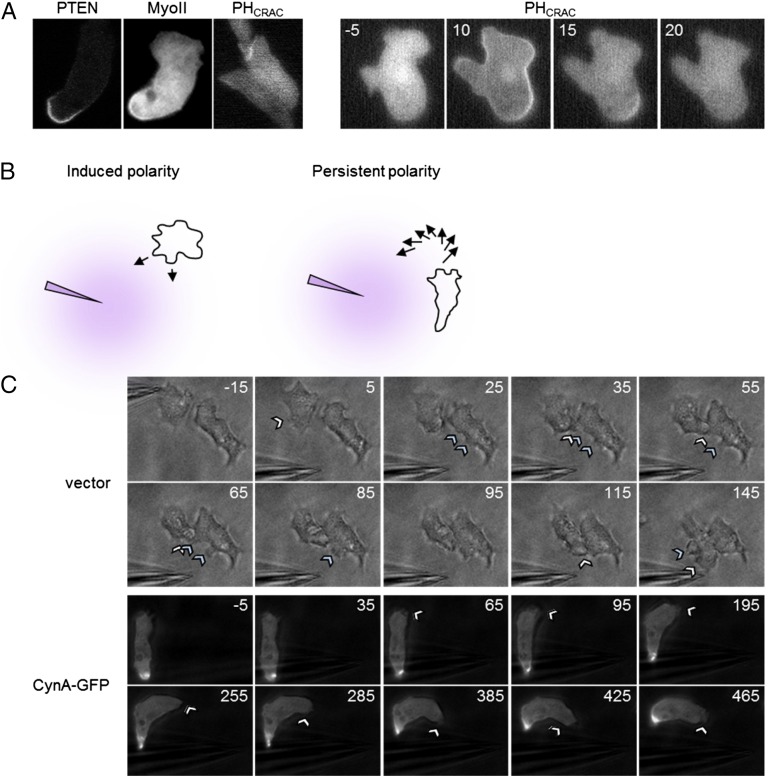
Fig. S5.
(A) Differentiated cynA- cells expressing PTEN-GFP, mCherry-Myosin II, or the PIP3 biosensor PHCRAC-RFP were imaged by time-lapse fluorescence microscopy during random migration (Left) or after global stimulation with 1 µM cAMP at 0 s (Right). For each of the cells shown in the panels on the left, the leading edge is positioned toward the top of the frame. Frames shown in the panels on the right were acquired at 5-s intervals, and time (s) after the addition of cAMP is indicated. The translocation of PHCRAC-RFP to the membrane was similar to that of wild-type cells. (B) A schematic to illustrate how cell polarity affects the response of cells to changes in chemoattractant gradients. Weakly polarized cells form new protrusions to rapidly reorient themselves with respect to the repositioned cAMP source. Highly polarized cells do not form new protrusions but instead maintain their existing leading edge and slowly turn to face the new gradient. (C) Partially differentiated wild-type cells expressing CynA-GFP or a vector control were imaged by fluorescence or brightfield time-lapse microscopy for 10 min at 10-s intervals while migrating toward a micropipette filled with cAMP. Once the cells began migrating toward the cAMP source, the micropipette was repositioned such that the direction of the gradient was approximately reversed. Time (s) is indicated for each frame, such that 0 s is the first frame acquired after the micropipette was repositioned. Arrowheads denote the formation of new protrusions. (Magnification, 40×.)

