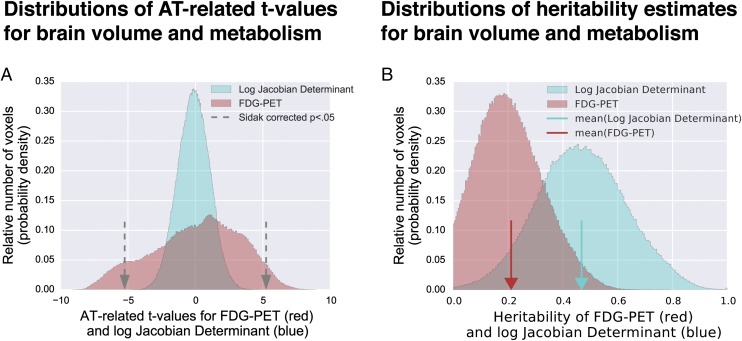
Fig. 2.
Histograms of voxelwise AT-related brain metabolism (red) and brain volume (blue) demonstrate significant relationships for brain metabolism but not brain volume (A). Gray arrows represent the threshold for reaching significance at a Šidák-corrected P < 0.05. Histograms of heritability estimates for brain metabolism (red) and brain volume (blue) demonstrated significant heritability for many voxels of both measures, and on average greater heritability of brain volume (see main text for details) (B). Red and blue arrows indicate the mean heritability estimates for FDG-PET and the log-Jacobian determinant, respectively.

