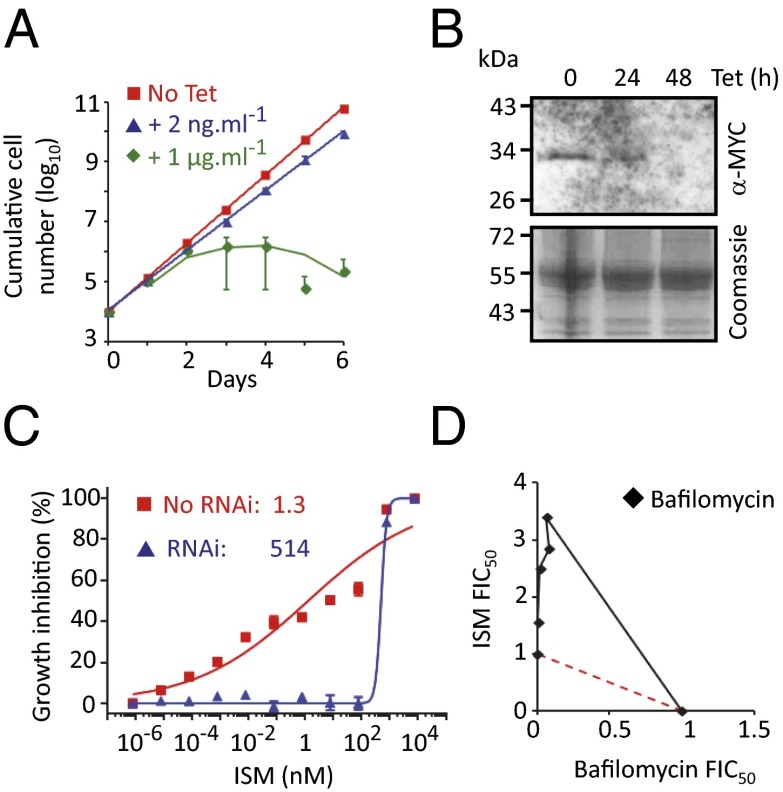
Fig. 2.
V-ATPase function sensitizes cells to isometamidium. (A) Cumulative growth of V-ATPase subunit (Vo-c″: Tb927.6.5050) RNAi strains. Error bars indicate SD calculated from two independent strains. (B) Western blot analysis showing depletion of the V-ATPase c″ subunit that was MYC tagged at the native locus. The Coomassie panel serves as a loading control. Tetracycline was applied at 2 ng/mL. (C) Dose–response curves for ISM in V-ATPase RNAi strains. EC50 values are indicated. Error bars indicate SD from two experiments carried out in triplicate. No RNAi refers to the uninduced (−Tet) control. (D) Isobologram analysis with ISM and the V-ATPase inhibitor bafilomycin. The red dashed line indicates a simple additive relationship. Data points above this line indicate antagonism between the two compounds, which was calculated using data from three experiments. FIC50, 50% fractional inhibitory concentration.

