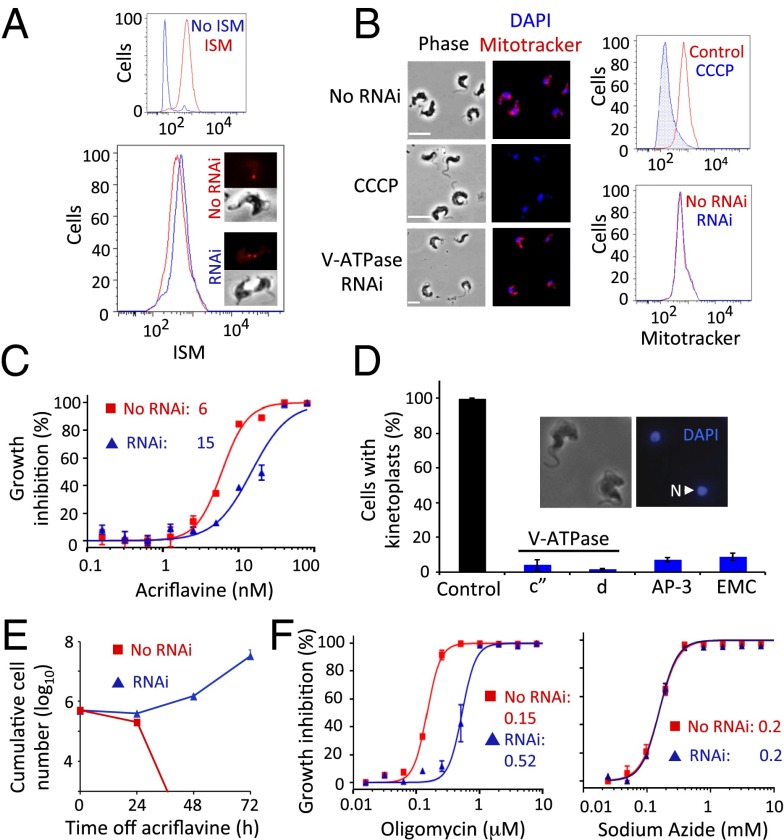
Fig. 4.
ATP synthase uncoupling and dyskinetoplasty in cells with acidic compartment defects. (A) Flow cytometry and microscopy analysis of ISM staining following V-ATPase c″ subunit RNAi. The smaller panel indicates the ISM-induced shift in fluorescence. (B) Microscopy and flow cytometry analysis of staining with the cationic fluorophore, Mitotracker following V ATPase c″ subunit RNAi. The depolarizing agent, CCCP, prevents Mitotracker accumulation and serves as a control for loss of ΔΨmito. (Scale bars, 10 μm.) (C) Dose–response curves for acriflavine in V-ATPase c″ subunit RNAi strains. Error bars indicate SD from two experiments carried out in triplicate. (D) Proportions of cells that retain detectable DAPI-stained kinetoplasts following acriflavine exposure. The RNAi strains tested are indicated. Control cells are WT, untreated. Error bars represent SD calculated from two independent strains. (Inset) Two dyskinetoplastic trypanosomes. N, nucleus. (E) Cumulative growth of V-ATPase RNAi strains (Vo-c″ subunit) after exposure to acriflavine. Error bars indicate SD calculated from two independent strains. (F) Dose–response curves for oligomycin and sodium azide in V-ATPase RNAi strains (Vo-c″ subunit). Error bars as in C.

