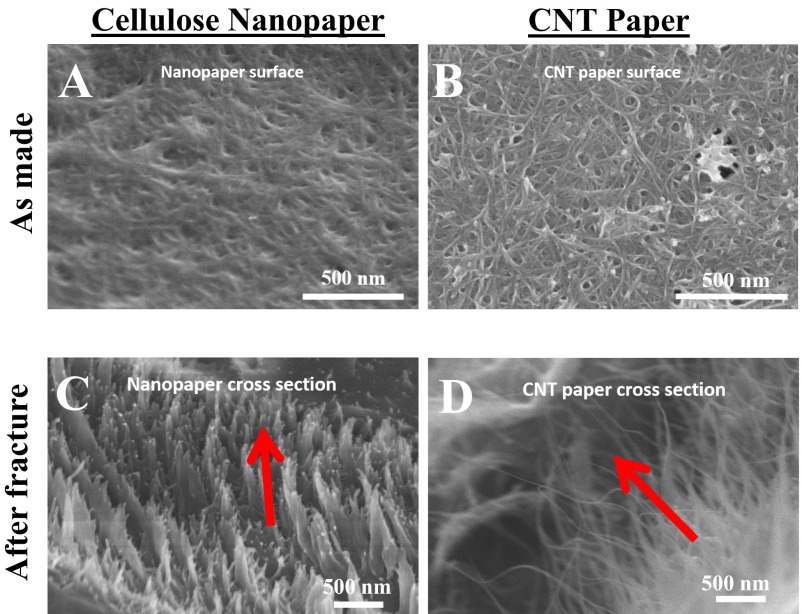
Fig. S8.
SEM images of (A) the surface of the as-made cellulose nanopaper (with a mean diameter of CNF fibers of 28 nm) and (B) the surface of the as-made CNT paper, both showing random distribution of constituent fibers. (C and D) SEM images of the cross-section of failure of the cellulose nanopaper and CNT paper, respectively, after the tensile tests. In both C and D, it is evident that the initially random network of constituent fibers aligns along the tensile loading direction indicated by the arrows.

