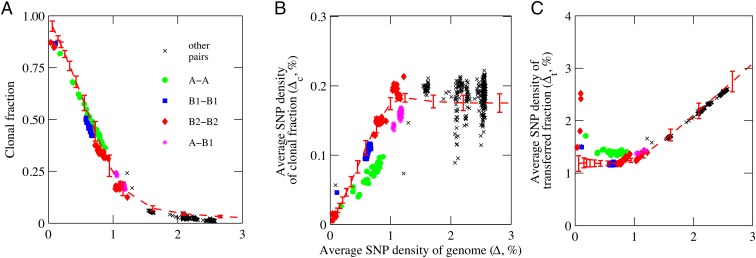
Fig. 3.
Values of clonal fraction, Δc, and Δt as a function of overall divergence Δ in 496 basic-genome pairs. (A) Clonal fraction fc; (B) average SNP density in the clonal fraction Δc; (C) average SNP density in the transferred fraction Δt. Data points for genome pairs within evolutionary groups A are given by solid green circles; B1 by blue squares; B2 by red diamonds; between A and B1 by violet asterisks; and other pairs by a black X. Dashed red lines with error bars are values predicted by the computational model given in Supporting Information. Error bars correspond to SD of 100 runs of the model.

