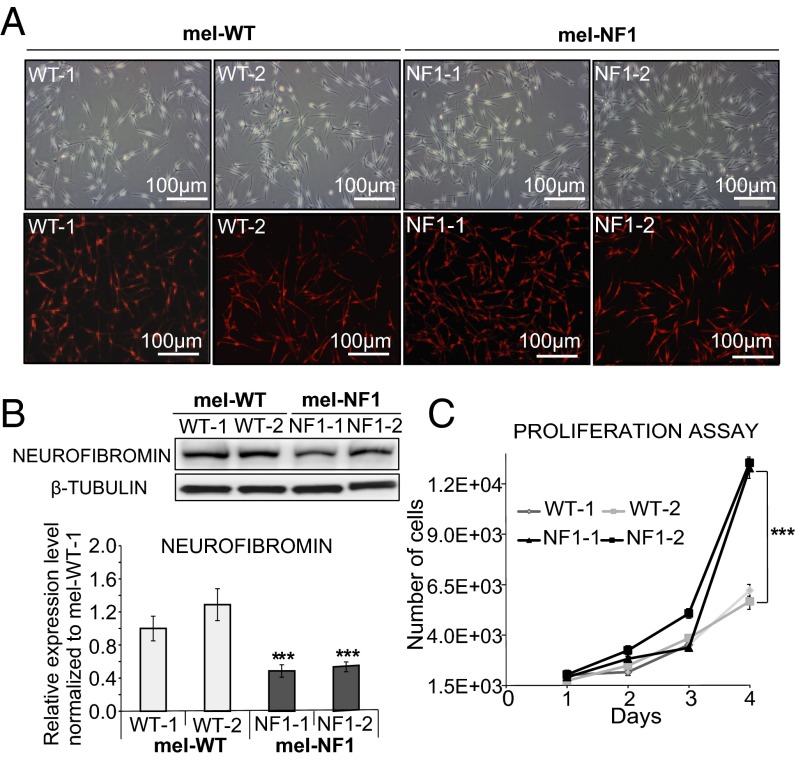
Fig. 1.
Characterization of mel-NF1 cells derived from hESCs carrying an NF1 mutation. (A) Microscopy analysis of mel-WT and mel-NF1 cells, and immunofluorescence analysis of the melanocyte marker TYRP1 in mel-WT and mel-NF1 cells. (Scale bar: 100 μm.) (B) Western blot analysis of neurofibromin expression in mel-WT and mel-NF1 cells. β-tubulin served as a loading control. Densitometry measurement of protein levels was relative to control mel-WT-1 cells. Data are presented as mean ± SD (n = 3) normalized to the expression in WT-1 cells. (C) Automated quantification at different time points after plating of DAPI nuclear staining in mel-WT and mel-NF1 cells. Results are expressed as mean ± SD (n = 3). ***P < 0.001, ANOVA followed by Dunnett’s multiple-comparison test with WT-1.

