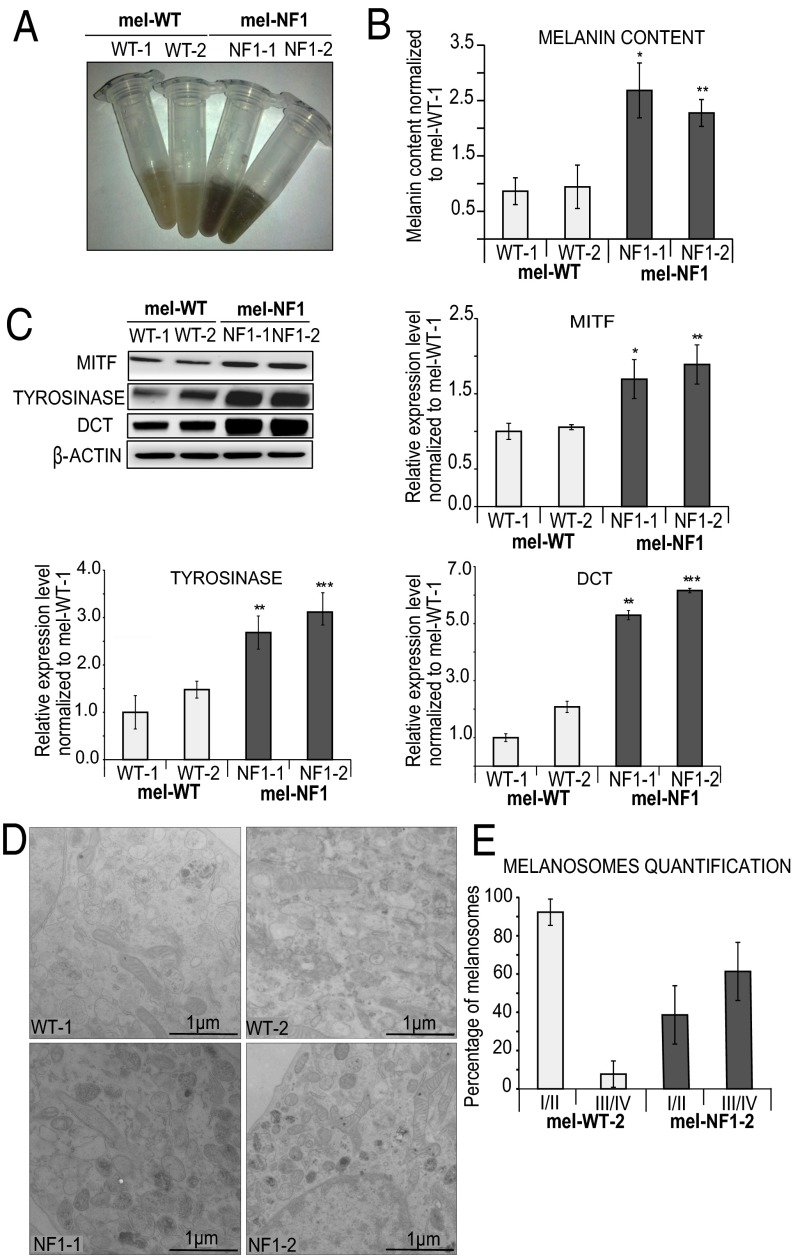
Fig. 2.
Phenotypic changes in melanocytes associated with NF1 mutation. (A) Representative cell lysates from mel-WT and mel-NF1 cells. (B) Quantification of melanin cell content by spectrophotometry in mel-WT and mel-NF1 cells. Measurements were performed using 105 cells of each cell type. Results are expressed as mean ± SD (n = 3). (C) Western blot analysis of MITF, tyrosinase, and DCT expression in mel-WT and mel-NF1 cells. β-actin served as a loading control. Densitometry measurement of protein levels is presented as mean ± SD (n = 3) normalized to the expression in WT-1 cells. (D) Representative EM images of melanosome stages in mel-WT and mel-NF1 cells. Characteristic immature unpigmented (stage I/II) and mature pigmented (stage III/IV) melanosomes are observed in the soma of melanocytes. (Scale bar: 1 µm.) (E) Quantification of melanosome maturation in mel-WT-2 and mel-NF1-2 cell lines. Data are presented as mean ± SD (n = 100 stages of melanosomes). *P < 0.05, **P < 0.01, ***P < 0.001, ANOVA followed by Dunnett’s multiple-comparison test with WT-1 cells.

