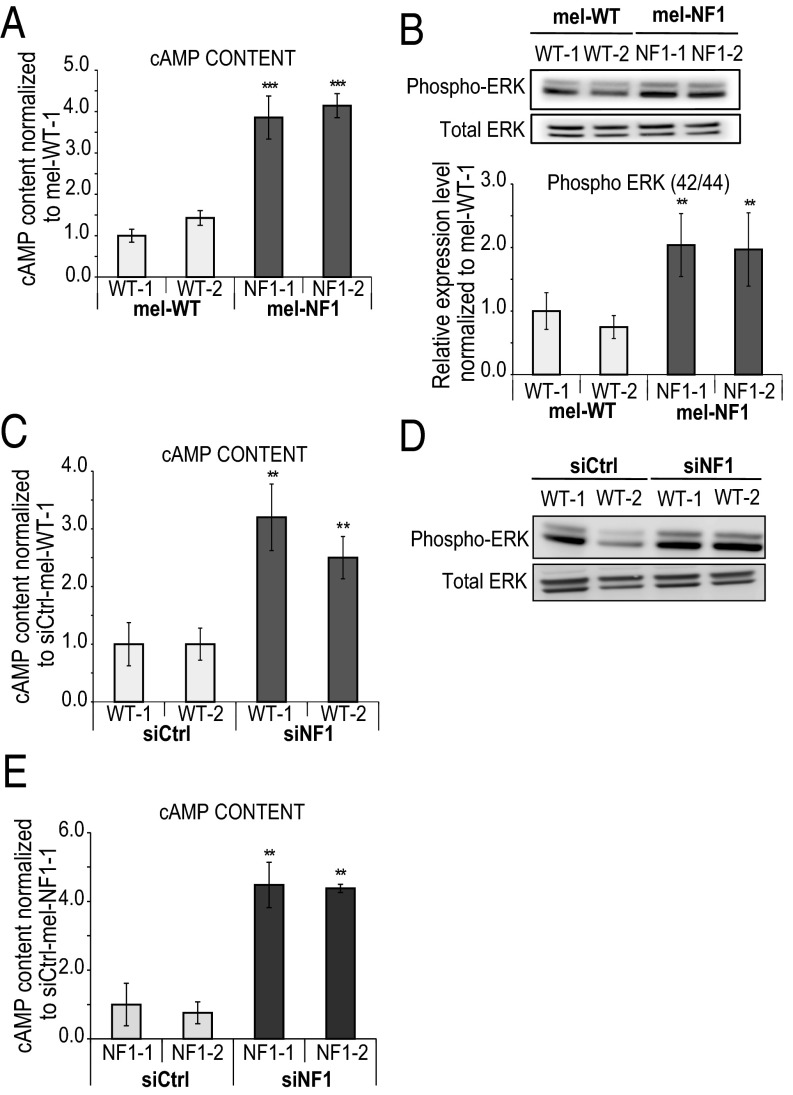
Fig. 4.
Impact of neurofibromin expression in cAMP and ERK1/2 signaling pathways in melanocytes. (A) Direct ELISA analysis of cAMP content in mel-WT and mel-NF1 cells. Results are expressed as mean ± SD (n = 3). Measurements were performed using 105 cells of each cell type. The results were normalized to siCtrl-mel-WT-1 cells. (B) (Upper) Western blot analysis of Phospho-p44/42 MAPK (ERK1/2) in mel-NF1 cells compared with mel-WT cells. Total ERK served as a control. (Lower) Densitometry measurement of protein levels relative to control mel-WT-1 cells. Results are expressed as mean ± SD (n = 3). (C) Direct ELISA analysis of cAMP content in siCtrl-mel WT-1 and WT-2 and siNF1-mel WT-1 and WT-2 cells. Measurements were performed using 105 cells of each cell type. Results were normalized to siCtrl-mel WT-1 cells and are presented as mean ± SD (n = 3). (D) Western blot analysis of Phospho-p44/42 ERK1/2 in siCtrl-mel WT-1 and WT-2 and siNF1-mel WT-1 and WT-2 cells. Total ERK served as a control (n = 1). (E) Direct ELISA analysis of cAMP content in siCtrl-mel NF1-1 and NF1-2 and siNF1-mel NF1-1 and NF1-2 cells. Measurements were performed using 105 cells of each cell type. The results were normalized to siCtrl-mel NF1-1. Results are expressed as mean ± SD (n = 3). **P < 0.01, ***P < 0.001, ANOVA followed by Dunnett’s multiple-comparison test compared with WT-1 (A and B), siCtrl-mel WT-1 (C), or siCtrl-mel NF1-1 (E).

