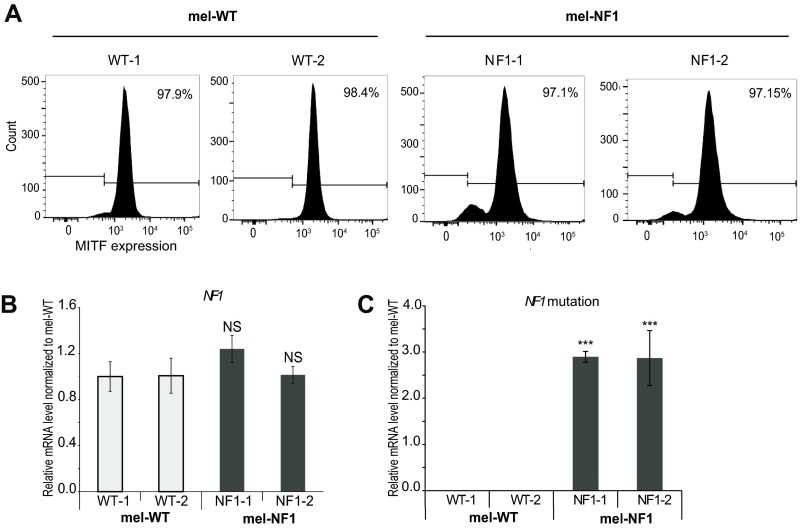
Fig. S1.
Characterization of mel-NF1 cells. (A) Flow cytometry analysis of the melanocyte marker MITF in mel-WT-1 and WT-2 and mel-NF1-1 and NF1-2 cells. (B) qRT-PCR analysis of NF1 mRNA expression in mel-WT-1 and WT-2 and mel-NF1-1 and NF1-2 cells. qRT-PCR results are presented as fold change relative to mel-WT-1 cells after normalization against housekeeping gene 18S (n = 3). (C) Taqman qPCR of mutated probe (without four nucleotides) vs. WT probe in mel-WT-1 and WT-2 and mel-NF1-1 and NF1-2 cells. qRT-PCR results are presented as fold change relative to mel-WT-1 cells (n = 3). NS, not significant. ***P < 0.001, ANOVA followed by Dunnett’s multiple-comparison test with mel-WT-1 cells.

