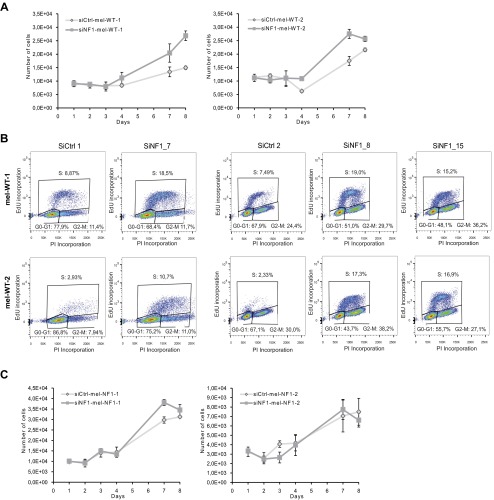
Fig. S4.
Proliferation rate after neurofibromin depletion. (A) Automated quantification at different time points after plating of DAPI nuclear staining in siCtrl-mel-WT and siNF1-mel-WT cells. (B) Cell cycle progression after EdU incorporation in siCtrl-mel-WT and siNF1-mel-WT cells (siNF1_7, siNF1_8, siNF1_15) by flow cytometry analysis. Annotations indicate distribution of cells in G0/G1, S, G2, and M phases (15,000 events total). (C) Automated quantification at different time points after plating of DAPI nuclear staining in siCtrl-mel-NF1 and siNF1-mel-NF1 cells.

