Fig. 1.

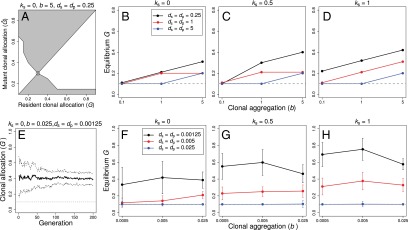
Summary of invasion analysis and stochastic simulation results showing obtained equilibrium values of allocation to clonal growth G for the indicated values of the clonal clumping variable b, the dispersal distances for pollen (dp) and seeds (ds), and the magnitude of inbreeding depression (ks). An example pairwise invasion plot (PIP) is shown for the indicated values of b, dp, ds, and ks (A). PIPs indicate the combinations of Ĝ vs. G for which mutant allocations to Ĝ are associated with higher (white areas of the PIP) or lower fitness (gray areas of the PIP) than the resident value of G. The intersection of the white and gray areas (marked with a circle) indicates the value of G for which the mutant and resident values of G are equal (i.e., the equilibrium value of G). A similar example from the stochastic simulations indicating the evolutionary trajectory of G (± 1 SD) values is shown for the analogous values of b, dp, ds, and ks as in A (E). In the absence of inbreeding depression (ks = 0), clonal allocations were low (or zero) unless dispersal distances of pollen and seeds were low and/or clones were spread out spatially (b ≥ 1) (B and F). Allocations to clonal growth (G) were higher under spatially restricted pollen and seed dispersal (dp = ds = 0.25 in the invasion analysis; dp = ds ≤ 0.005 in the simulations) under intermediate values of inbreeding depression (ks = 0.5) in comparison with results obtained in the absence of inbreeding depression (C and G). When selfed seeds were inviable (ks = 1), allocations to clonal growth were higher again, especially under spatially restricted pollen and seed dispersal (D and H). Note that the minimum value of G was 0.1 (i.e., genets were constrained to have at least n = 1 ramets; indicated with a dashed line).
