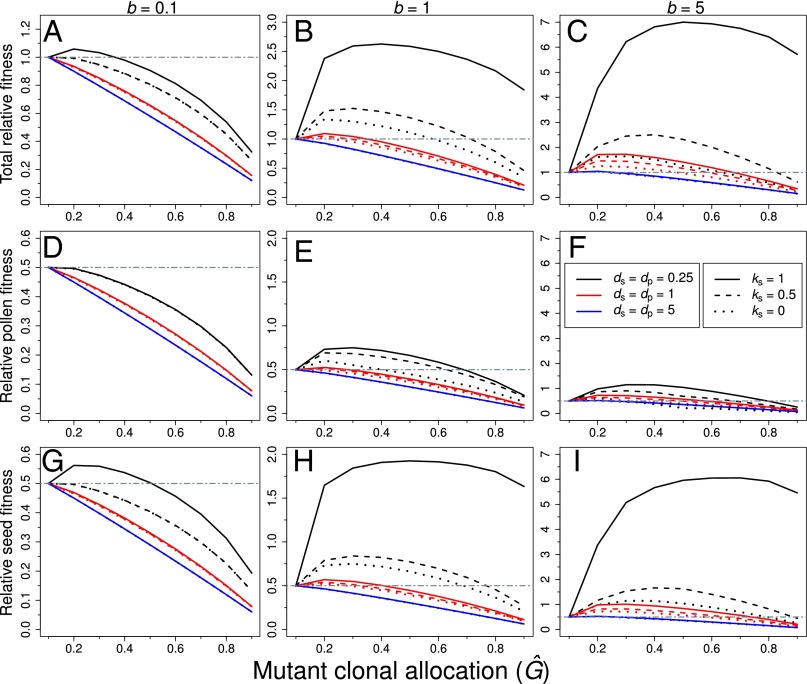
Fig. 2.
Summary of the fitness of mutant phenotypes relative to a resident nonclonal phenotype for the full range of Ĝ values considered in the invasion analysis. Panels indicate the total fitness (via both pollen and seeds, i.e., W) (A–C), male fitness only (i.e., via pollen) (D–F), and female fitness (i.e., via seeds) (G–I) under ks = 1 (solid lines), ks = 0.5 (dashed lines), and ks = 0 (dotted lines); colors refer to the average dispersal distances of pollen and seeds: ds = dp = 0.25 (black), ds = dp = 1 (red), and ds = dp = 5 (blue). When clonal growth was associated with a phalanx growth form (b = 0.1), clonal phenotypes had lower fitness than nonclonal phenotypes (i.e., WĜ = 0.1 > WĜ > 0.1) unless selfed seeds were inviable (ks = 1) and the dispersal of pollen and seeds was spatially restricted (i.e., ds = dp = 0.25) (A). When clonal growth occurred via the outward expansion of the genet (i.e., b ≥ 1), clonal phenotypes often had higher fitness than nonclonal phenotypes (i.e., WĜ = 0.1 < WĜ > 0.1), particularly under spatially restricted dispersal of pollen and seeds (i.e., ds = dp ≤ 1) and under higher values of inbreeding depression (i.e., ks ≥ 0.5) (B and C). Unless clonal growth was associated with guerrilla growth forms (i.e., b = 5), clonal phenotypes usually had lower fitness through male function (pollen) than nonclonal phenotypes (D–F). By contrast, clonal growth was often associated with greater fitness through seeds, particularly when clonal growth was associated with the outward growth of the genet (i.e., b ≥ 1) and when the dispersal of seeds was spatially restricted (i.e., ds ≤ 1) (G–I). Note that the scale of the y axis differs with the value of b and whether total fitness or only its male or female components are depicted.

