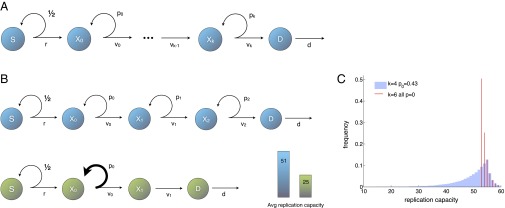
Fig. 1.

(A) Lineage begins with stem cells S; progresses through a sequence of transit-amplifying stages (); and ends with differentiated cells D, which are postmitotic and die at a certain rate d. Cells in stage divide at rate , producing two cells with probability or two cells with probability . The stem cell’s division rate is r. (B) Two alternative architectures for the same target number of intermediate cell divisions. For the cell lineage in blue , the resulting average replication capacity of dividing cells is 51. An optimal cell lineage is depicted in green . In both cell lineages, , , and all . The average replication capacity of dividing cells is minimized by a tissue architecture in which, at most, one intermediate cell type has self-renewal capabilities and the number of transit-amplifying stages is kept as small as possible (a discussion is provided in the main text). (C) Distribution of the replication of capacity of dividing cells for two alternative architectures that produce the same number of transit-amplifying divisions. In both cases for all j, the replication capacity of stem cells is , and the influx of cells from the stem cell compartment is . Red lines illustrate and all . Blue bars illustrate , , and all other .
