
Fig. S6.
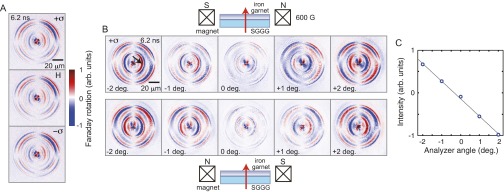
Appearance of magnetoelastic waves upon the variation of pump polarization and the analyzer angle. (A) Faraday microscopy snapshots taken at 6.20 ns after the pump excitation (120 nJ at 1,300 nm) under the application of magnetic field of 650 G with varying pump polarization. The image without pump excitation is subtracted from each snapshot. (B) Angle of the analyzer (Glan Laser prism) was shifted up to 2° from the extinction condition to illustrate the contrast reversal. The direction of magnetic field (600 G) was reversed for the top and the bottom rows as indicated by the schematics. The exposure time was 30 s. SGGG is a nonmagnetic substrate. (C) Signal intensity at the position indicated by a black arrow in C, as a function of analyzer angle. The solid line shows a linear fit.