Fig. 3.
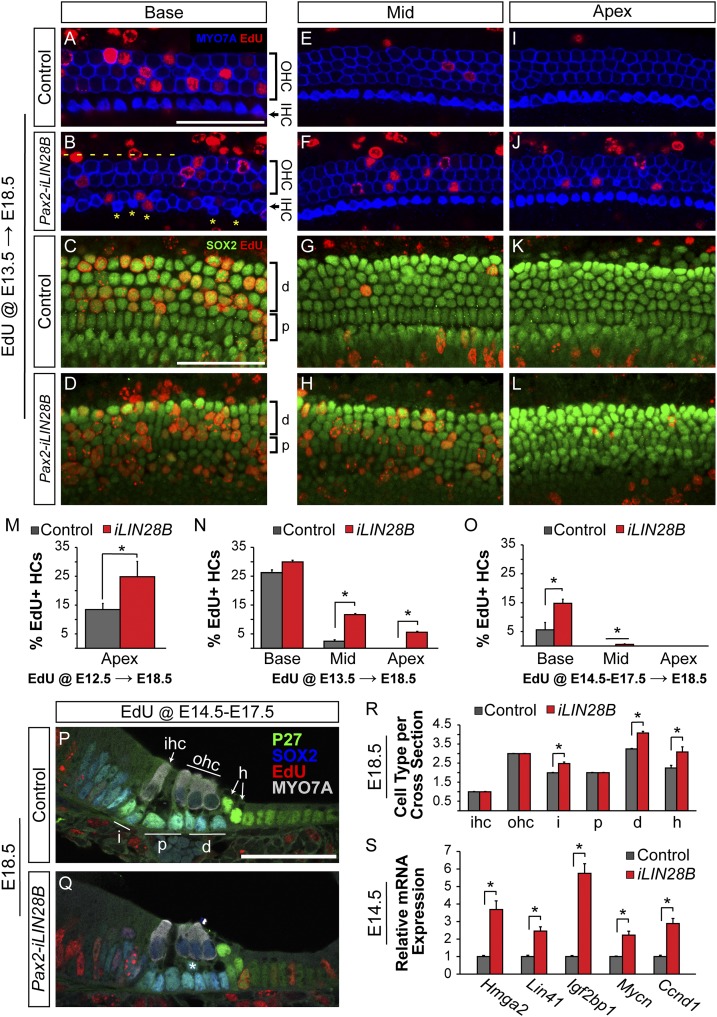
LIN28B overexpression delays progenitor cell cycle withdrawal and causes mispatterning of the auditory sensory epithelium. (A–L) EdU incorporation (red) in HCs (MYO7a, blue) and SCs (SOX2, green) was analyzed at E18.5 following a single EdU pulse at E13.5. Shown are whole-mount preparations of basal, mid, and apical cochlear segments from control and Pax2-iLIN28B inner ears. Yellow asterisks mark ectopic IHCs, and dashes indicate missing OHCs. (M–O) Quantification of HC-specific EdU incorporation in E18.5 control (gray) and Pax2-iLIN28B (red) cochlear tissue following a single EdU pulse at E12.5 (M), a single EdU pulse at E13.5 (N), or once daily EdU pulses from E14.5 through E17.5 (O). Data expressed as mean ± SEM (n = 2, *P < 0.05). (P and Q) Cross-sections of E18.5 control and Pax2-iLIN28B cochleae. EdU (red) was given once daily from E14.5 to E17.5. HCs are marked by MYO7A (white) and SC subtypes are marked by P27 (green) and SOX2 (blue) immunostaining. Asterisk (Q) marks an ectopic SC disrupting the bilayered patterning of the cochlear epithelia in an iLIN28B cochlea. (R) Quantification of HC and SC subtypes per cochlear cross-section in control (gray) and Pax2-iLIN28B (red) cochleae. Data expressed as mean ± SEM (n = 3 animals per group, 5 cross-sections per animal; *P < 0.05). (S) RT-qPCR expression analysis of let-7 target genes associated with growth and proliferation in E14.5 control (gray) and Pax2-iLIN28B (red) cochlear epithelia. Data expressed as mean ± SEM (n = 3, *P < 0.05). d, Deiter’s cell; h, Hensen’s cell; i, phalangeal cell; p, pillar cell. (Scale bars: 50 μm.)

