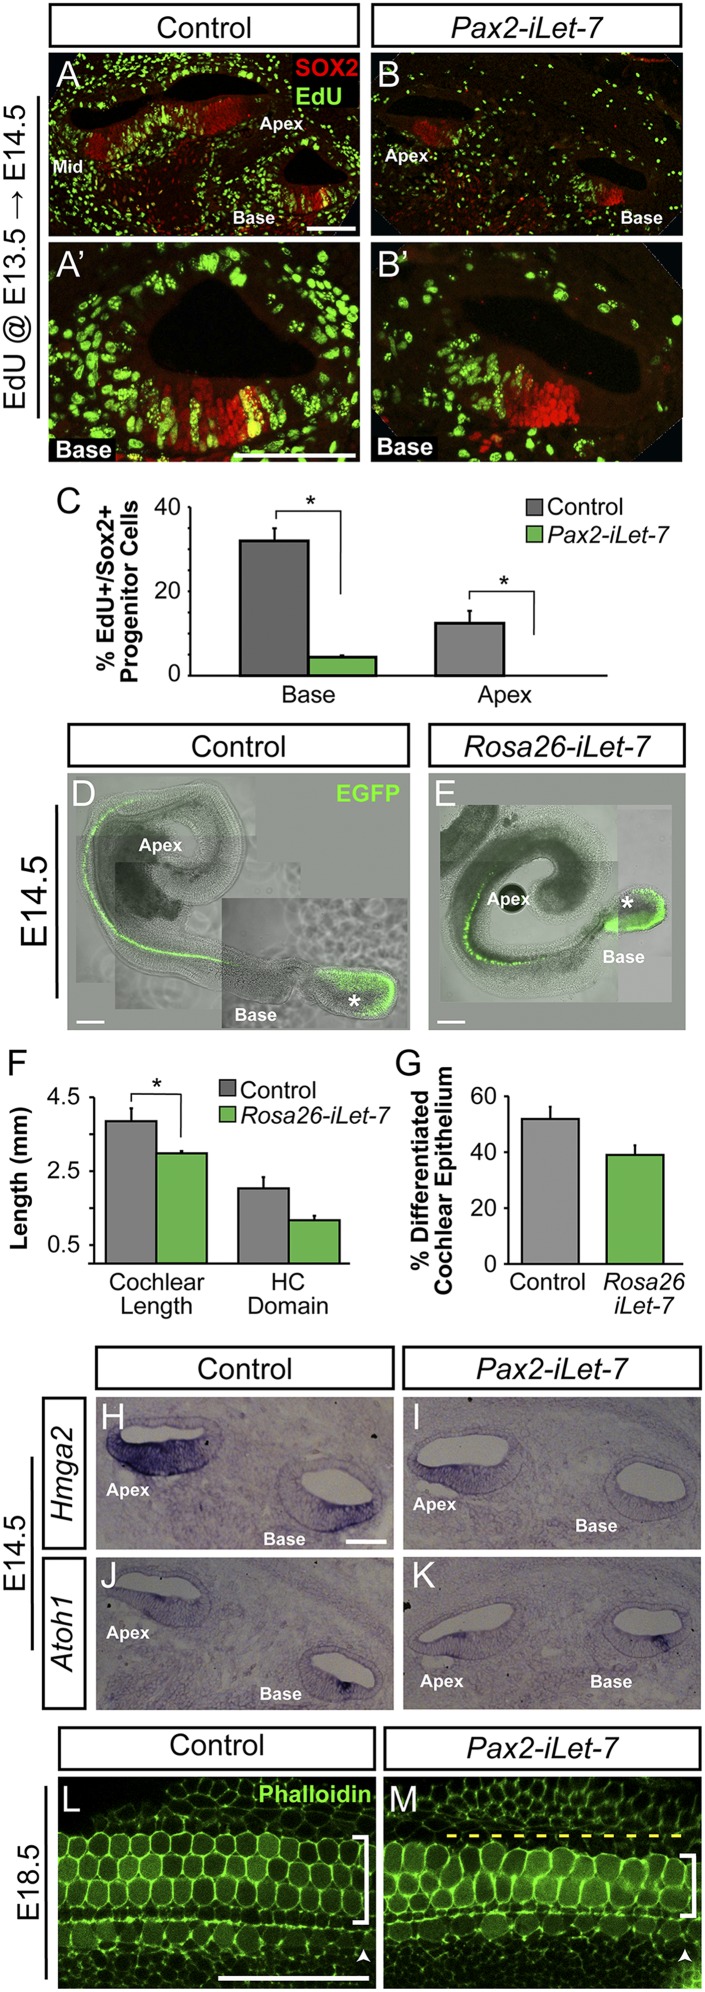
Fig. 4.
Let-7 overexpression accelerates progenitor cell cycle withdrawal but not differentiation. (A–B′) Cross-sections of E14.5 control and Pax2 iLet-7 cochleae. A single EdU pulse was given at E13.5 and EdU incorporation (green) within SOX2+ (red) prosensory progenitor cells was analyzed after 24 h. High-power images of the basal turn are shown in A′ and B′. (C) Quantification of EdU incorporation shown in A–B′. Data expressed as mean ± SEM (n = 2, *P < 0.05). (D and E) Bright field and green fluorescence image overlays of acutely isolated E14.5 control and Rosa26 iLet-7 cochlear ducts. Atoh1/nEGFP reporter (EGFP, green) marks nascent HCs. Asterisks denote EGFP expression within HCs of the vestibular sacculus. (F and G) Analysis of the extent of HC differentiation in E14.5 control and Rosa26-iLet-7 cochlear ducts shown in D and E. Data expressed as mean ± SEM (n = 4, *P < 0.05). (H–K) ISH-based analysis of Hmga2 (H and I) and Atoh1 (J and K) expression in E14.5 Pax2-iLet-7 and control cochlear tissue. (L and M) HC phenotype in E18.5 control and Pax2-iLet-7 cochlear whole mounts. HCs are marked by phalloidin (green). Shown is the basal turn. Arrowheads indicate IHC domain, brackets indicate OHC domain, and yellow dashes indicate missing OHCs. (Scale bars: A–B′ and H–K, 50 μm; D and E, 200 μm.)

