
Fig. 1.
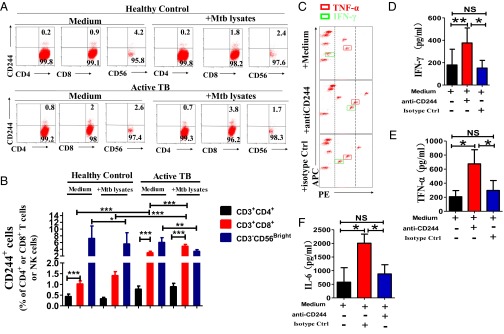
CD244 is preferentially up-regulated on CD8+ T cells during active MTB infection, and blockade of CD244 signaling enhances production of IFN-γ and TNF-α by CD8+ T cells. (A) Representative flow cytometric dot plots show the ex vivo expression of CD244 on CD4+ and CD8+ T cells and CD3-CD56Bright NK cells from one healthy control and one patient with active TB. Data were gated on CD3+CD4+, CD3+CD8+, and CD3-CD56Bright. Percentages of CD244+ T (or NK) cells are shown in the upright quadruple in each dot plot. PBMCs were treated either with or without ex vivo restimulation with MTB lysates. (B) Pooled data show the percentages of CD244+CD4+ T cells, CD244+CD4+ T cells, or CD244+NK cells among total CD3+CD4+ T cells, CD3+CD8+ T cells, and NK cells (n = 15). Error bars represent SEM. (C) Representative CBA assays of a patient with active TB showing that treatment of anti-CD244 mAb induced significant increase of concentration of IFN-γ and TNF-α in culture supernatants of CD8+ T cells purified from PBMCs of patients with active TB. The red and green squares mark the TNF-α and IFN-γ, respectively. The dashed lines mark relative fluorescent intensity of TNF-α and IFN-γ. Treatment of anti-CD244 mAb increased the concentrations of TNF-α and IFN-γ (i.e., the fluorescent intensity of phycoerythrin (PE) increased, and squares shift toward right). (D–F) Pooled data show the concentrations of IFN-γ, TNF-α, and IL-6 in the presence of indicated antibody treatment (n = 7). *P < 0.05; **P < 0.01; NS, no statistical significance. Error bars represent SEM from three independent experiments.