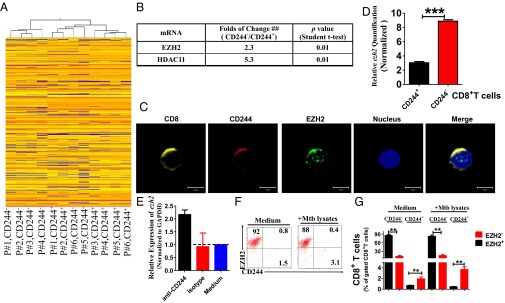
Fig. 2.

EZH2 correlates negatively with CD244 signaling. (A) Unsupervised clustering analysis of differentially expressed genes between CD244+CD8+ T cells and CD244−CD8+ T cells that were purified from PBMCs of patients with active TB. Individual squares represent the relative gene expression intensity of the given genes (rows) in each of six patients (columns), with red indicating an increase in expression and blue a decrease. (B) A table shows the fold of changes of expression of EZH2 and HDAC11 in CD244+CD8+ T cells overexpression in CD244−CD8+ T cells. (C) Typical confocal microscopic images show the expression of EZH2 in CD244high CD8+ T cells in PBMCs derived from patients with active TB. (Scale Bar: 5 μm.) (D) qPCR validation of differential expression of EZH2 gene between CD244+CD8+ T cells and CD244−CD8+ T cells. (E) qPCR analysis of the EZH2 gene in PBMCs from patients with active TB treated with anti-CD244 mAb or control antibody for 5 d. Data are presented as relative expression levels of ezh2 in PBMCs treated with anti-CD244 mAb or control antibody over expression levels of ezh2 in PBMCs treated with medium (n = 7). Data were normalized to GAPDH. (F) Representative flow cytometric dot plot data showing expression of EZH2 and CD244 in CD8+ T cells of PBMCs with or without ex vivo restimulation with MTB lysates. Data were gated on CD8+ T cells. (G) Pooled data show the frequency of EZH2+CD244−, EZH2-CD244+, and EZH2+CD244+ subpopulations of CD8+ T cells over total CD8+ T cells (n = 6). **P < 0.01; NS, no statistical significance. Except for A, error bars represent SEM from two independent experiments.
