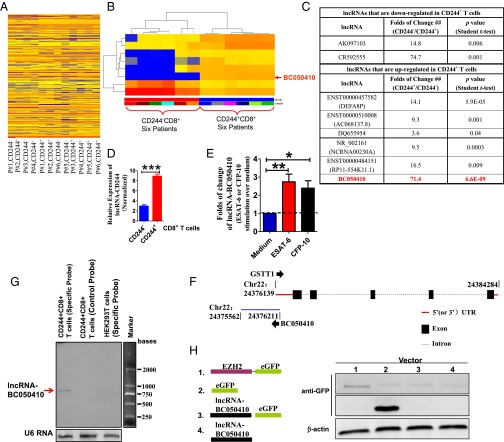
Fig. 3.
lncRNA-CD244 is highly expressed in CD244+CD8+ T cells during active TB. (A) Unsupervised clustering analysis of differentially expressed lncRNAs between CD244+CD8+ T cells and CD244−CD8+ T cells that were purified from PBMCs of patients with active TB. Individual squares represent the relative lncRNA expression intensity of the given lncRNAs (rows) in each of the patients (columns), with red indicating an increase in expression and blue a decrease. (B) Supervised clustering analysis using differentially expressed lncRNAs that can distinguish CD244+CD8+ T cells from CD244−CD8+ T cells. (C) A table shows the folds of change and P values (Student t test) of eight lncRNAs that could distinguish CD244+CD8+ T-cell subpopulation from CD244−CD8+ T-cell subpopulation of six patients with active TB. (D) qPCR validation of differential expression of lncRNA-CD244 between CD244+CD8+ T cells and CD244−CD8+ T cells. (E) qPCR analysis of lncRNA-CD244 expression in CD244+CD8+ T cells purified from PBMCs of patients with active TB upon stimulation with MTB ESAT-6 (10 μg/mL) or CFP-10 (10 μg/mL) peptide pools for 5 d in vitro. (F) Schematic diagram of the lncRNA-CD244 genomic locus in human chromosome 22. The bars represent exons, dashed lines represent intron, red line represents 5′ (or 3′) UTR, and arrows indicate the direction of transcription. The length of lncRNA-CD244 is 796 bases, which overlapped 5′ UTR of GST θ1 (GSTT1) by 72 bases. No homologs of lncRNA-CD244 were found in mouse (Fig. S3 A and B). (G) Northern blot analysis show the expression of full-length lncRNA-CD244 in CD244+CD8+ T cells from patients with active TB using specific probe but not antisense control probe. No lncRNA-CD244 was detected in HEK293T cells. U6 RNA served as a control. (H) Plasmids as schematically shown at Left were transfected to HEK293T cells (Right). Immunoblotting using antibody specific to EGFP and fluorescent imaging (Fig. S5) showed that lncRNA-CD244-EGFP plasmid and lncRNA-CD244 plasmid did not express GFP. Error bars represent SEM. Data shown in D, E, G, and H are representative of at least two independent experiments.

