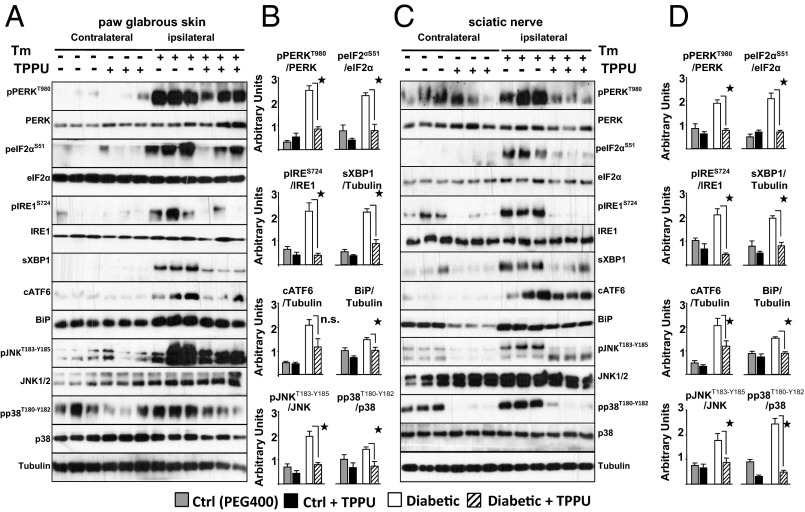
Fig. 4.
ER stress inducer Tm leads to activation of full range of ER stress responses within minutes. These are reversed by inhibition of sEH. Rats are given intraplantar Tm (20 μg) on the ipsilateral side and vehicle on the contralateral side with or without systemic TPPU (1 h before Tm, 10 mg/kg). Tissues are obtained 30 min post Tm, under deep anesthesia. (A and B) Quantification of markers of ER stress from Tm (ipsi-) and vehicle (contra) administered paw skin by Western blotting. Total skin lysates are immuno-blotted for targets specified next to each row using Tubulin as a loading control. Representative immunoblots of three rats from each group are shown. Bar graphs display expression of each target normalized to Tubulin or their respective unphosphorylated forms as indicated (n = 6 rats per group, Kruskal–Wallis one way analysis of variance on ranks followed by Student Newman–Keul's post hoc test, ★, P < 0.05). (C and D) Quantification of markers of ER stress in the sciatic nerve bundle of same rats as above by Western blotting. Total sciatic nerve lysates are immune-blotted for targets specified next to each row using Tubulin as a loading control. Representative immunoblots of three rats from each group are shown. Bar graph displays expression of each target normalized to Tubulin or their respective unphosphorylated forms as indicated (n = 6 rats per group, Kruskal–Wallis one way analysis of variance on ranks followed by Student Newman–Keul's post hoc test, ★, P < 0.05).

