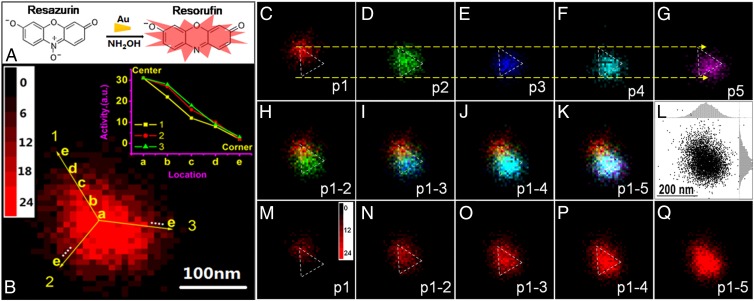
Fig. 3.
Time-lapsed single-molecule catalysis mapping on single Au nanoplate in 10 × 10 nm2 bins. (A) Fluorogenic reaction of resazurin reduced to resorufin by NH2OH catalyzed by Au nanoplates. (B) The 2D histogram of product molecules obtained on a Au nanoplate. (Inset) Gradient descent of activity along the three corners from the center of the Au nanoplate. (C–G) Sequential 2D histograms of every 1,000 product molecules. Different colors indicate different portions of product molecules obtained in time sequence: (C) p1: the first 1,000 product molecules; (D) p2: the second 1,000 product molecules; (E) p3: the third 1,000 product molecules; (F) p4: the fourth 1,000 product molecules; and (G) p5: the fifth 1,000 product molecules. (H–K) The overlapping of different portions: (H) (p1-2); (I) (p1-3); (J) (p1-4); (K) (p1-5). (L) Positions of product molecules detected on the nanoplate in K. (Insets) Histogram distribution in both X (up) and Y (right) directions. (M–Q) The 2D histograms with different numbers of product molecules obtained on the rod at different time: (M) the first 1,000 product molecules; (N) the first 2,000 product molecules; (O) the first 3,000 product molecules; (P) the first 4,000 product molecules; (Q) All of the observed (around 5,000) product molecules.

