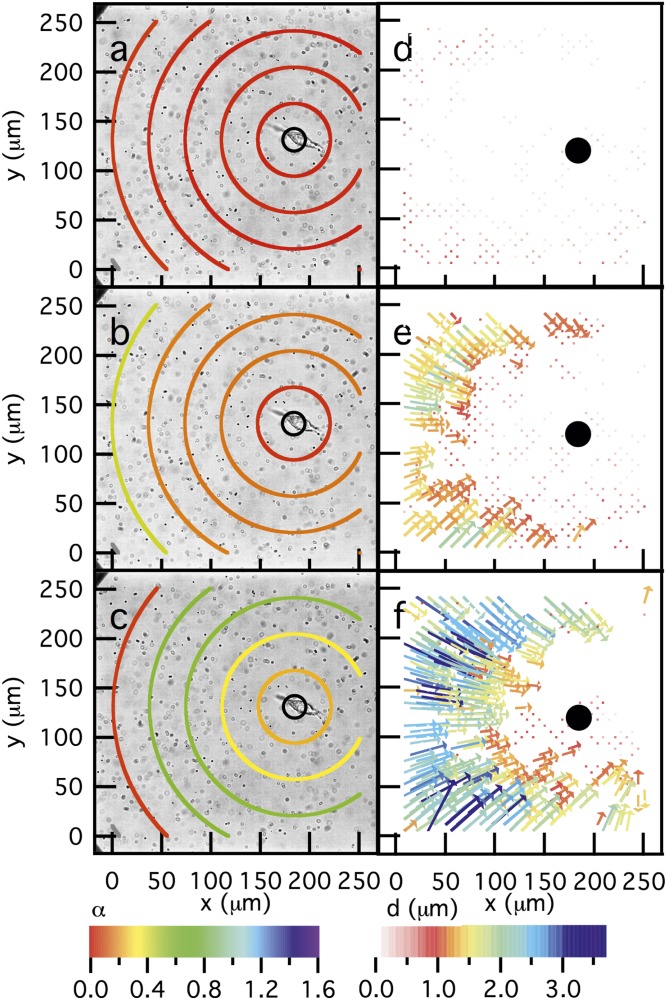
Fig. 3.
Dynamic rheological changes in the pericellular region during migration of an encapsulated hMSC over time. Data are taken at (A) 0, (B) 9, and (C) 27 min after the cell is identified. Particle image velocimetry (PIV) measurements quantify the long-time movement of probe particles between (D) 0 and 4, (E) 9 and 14, and (F) 23 and 27 min. Every other particle trajectory is displayed on PIV plots for clarity. Bright-field images are set in the background of MPT measurements with MSD values calculated spatially as the distance away from the cell. The z axis, indicated by color, is the logarithmic slope of the MSD, α, where a slope of 0 (red) indicates no particle movement, a slope of 1 (light blue) indicates Brownian motion, and a slope of 1.6 (purple) indicates ballistic motion. PIV measurements show the displacements using color and size of arrows. Warm colors and small arrows indicate small particle displacement, whereas cool colors and large arrows show large particle displacement. Both of these measurements confirm that, through time as the cell is spreading, the largest extent of degradation occurs furthest from the cell.

