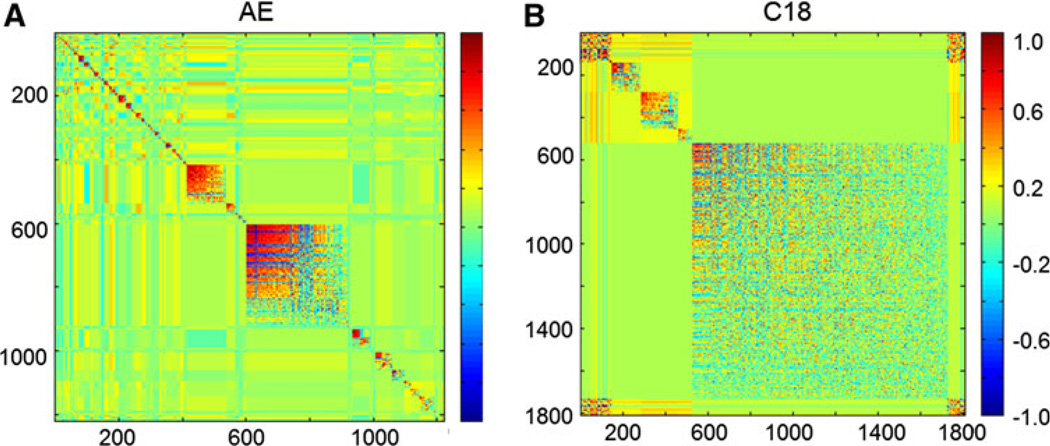
Fig. 4.
Modulated modularity clustering (MMC) heatmaps derived from marmoset samples with all m/z features with greater than 70% non-zero ion intensities in either the anion exchange column (1,809 m/z features) (a) or the reverse phase column (1222 m/z features) (b). Clusters of similar correlations are grouped as indicated in the legend (dark blue perfect anticorrelation, dark red perfect correlation)

