Fig. 2.

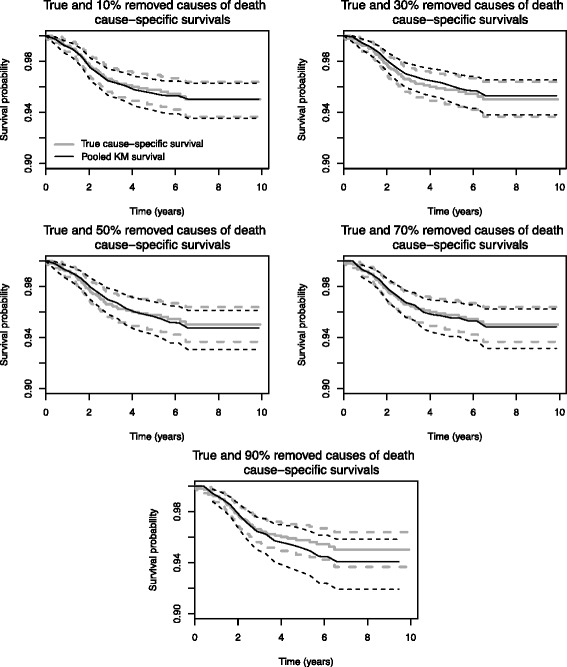
True cause-specific, pooled cause specific survival rates and their confidence intervals using the first sensibility method

True cause-specific, pooled cause specific survival rates and their confidence intervals using the first sensibility method