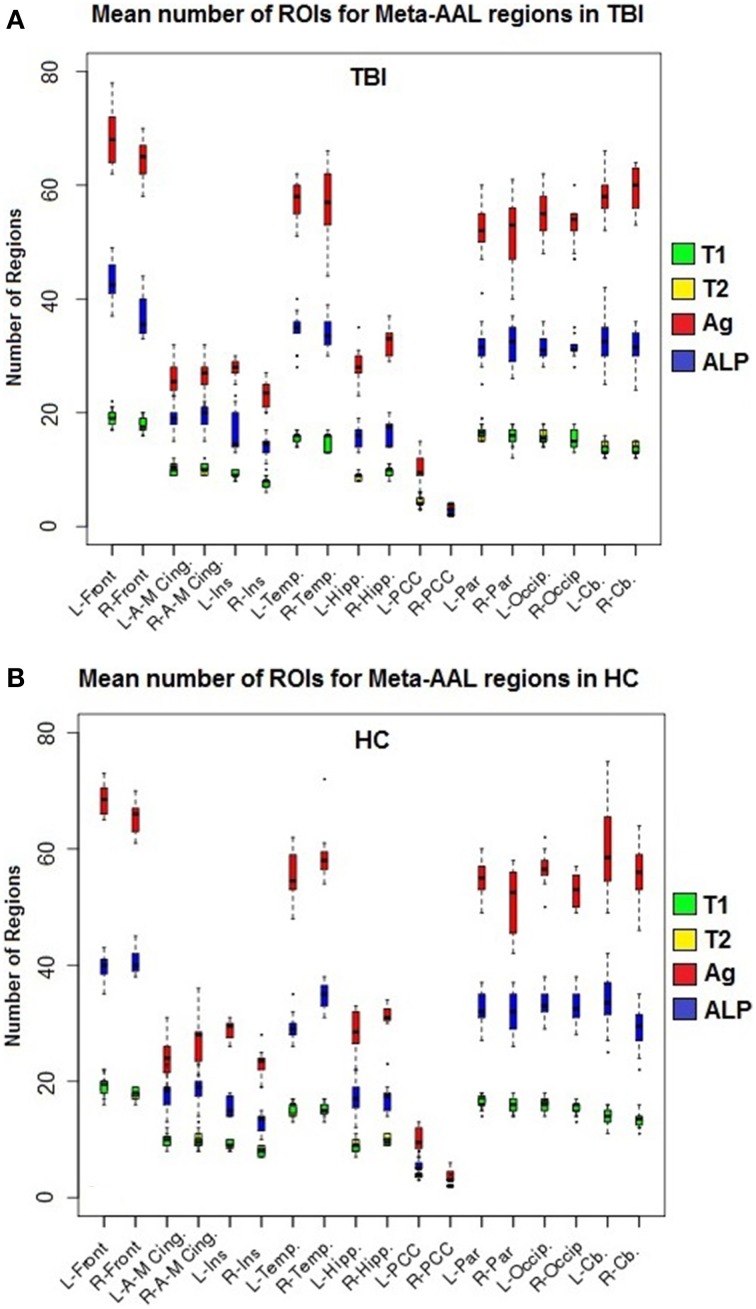
Figure 4.
Box plots of the mean number of ROIs for each meta-region. (A) Healthy control subjects, (B) TBI subjects; T1, Time 1 whole-brain modularity results (green); T2, Time 2 whole-brain modularity results; Ag, Aggregation of Time 1 and Time 2 (red); and ALP, Aggregation + Label propagation (blue). Abbreviations: A-M, anterior to middle; Cing, cingulate; Front, Frontal; Hipp, hippocampus; Ins, insula; L, left; Occip, occipital; Par, parietal; PCC, posterior cingulate cortex; R, Right, Temp, Temporal lobe.

