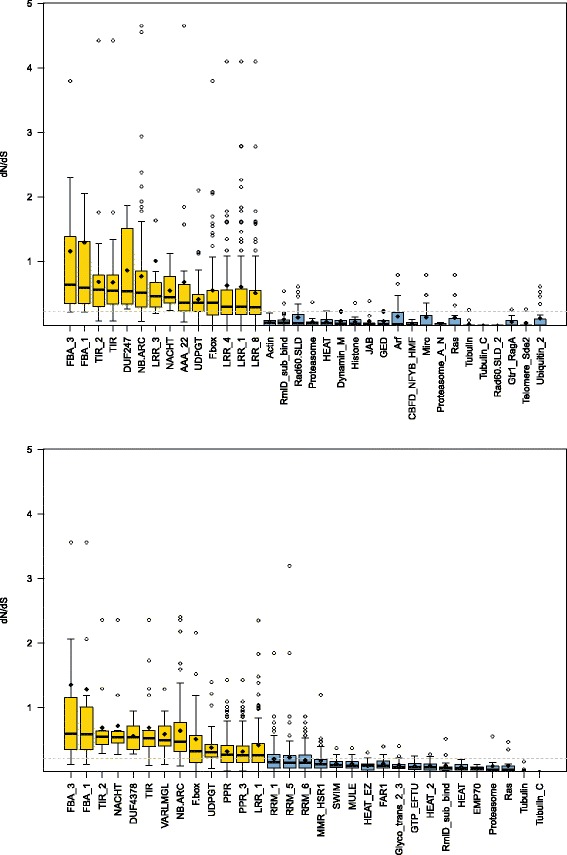
Fig. 1.

d N/d S by gene functional category. Boxplots of functional gene categories for Pfam accessions associated with significantly high (yellow) or low (blue) d N/d S for the comparisons of (a) Quercus lobata with Q. garryana and (b) the Q. lobata–Q. douglasii hybrid with Q. garryana. A few extreme d N/d S > 5 are not shown. Overall medians are marked as gray dashed lines, and the means for each accession are shown as small black diamonds
