Fig. 2.

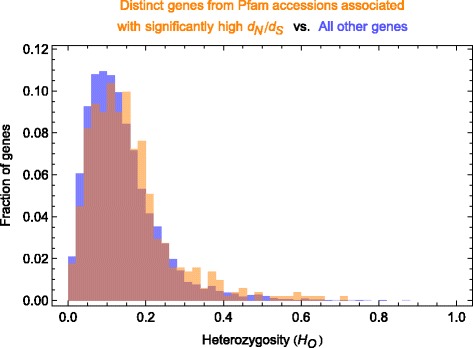
Mean observed heterozygosity per gene. Histograms of mean observed heterozygosity (H O) for each gene containing Pfam accessions with significantly high d N/d S (orange) versus all other genes (blue)

Mean observed heterozygosity per gene. Histograms of mean observed heterozygosity (H O) for each gene containing Pfam accessions with significantly high d N/d S (orange) versus all other genes (blue)