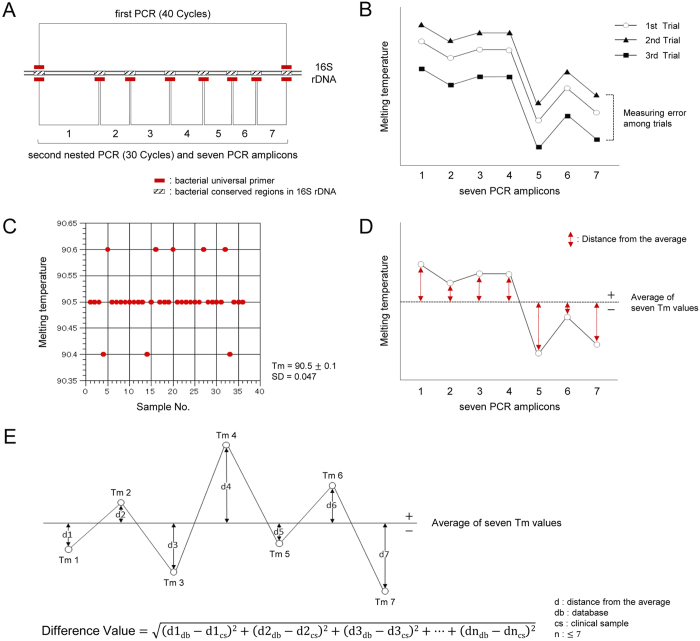
Figure 2. Concept of the Tm mapping method.
(A) The strategy for the primer designs is shown. Nested PCR is performed using seven bacterial universal primer sets, and then the seven Tm values are obtained. (B) Mapping the seven Tm values on two dimensions leads to the identification of the unique bacterial species-specific shape. The average of all seven Tm values includes the measurement error among trials; however, the Tm mapping shape is not affected by this type of error. (C) Using an analytical instrument with a high degree of thermal accuracy among PCR tubes and Tm value analysis with EvaGreen dye in 36 samples of the same bacterial DNA in the same trial, the tube-to-tube variation is within ±0.1 °C. (D) In order to analyze the Tm mapping “shape”, we developed a method to measure the distance of each individual Tm value from the average value. Tm values above the average receive a “+” designation, while those below the average receive a “−” designation. The Tm mapping shape is identified by comparing the seven distances obtained from the unknown bacteria to those in the database. (E) In order to identify a bacterial isolate, the identification software program calculates the Difference Values using the indicated formula. The closer the Difference Value is to zero, the more similar the Tm mapping shape is to the shape of a given species of pathogenic bacteria in the database.

