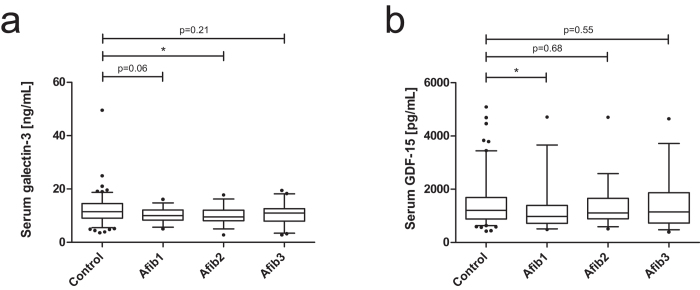
Figure 4. Analysis of serum levels of galectin-3 and GDF-15 in control and Afib patients.
Serum concentrations of galectin-3 (a) and GDF-15 (b) were quantified in control (n = 132) and arthrofibrosis patients (n = 95, Afib1 to Afibf3: increasing arthrofibrosis score) by ELISA. Boxes show the 25th to 75th percentiles; horizontal lines in the boxes show the median while vertical whiskers show the 5th to 95th percentile. *p < 0.05; **p < 0.01; ***p < 0.001 (Mann-Whitney U-test).

