Fig. 2.

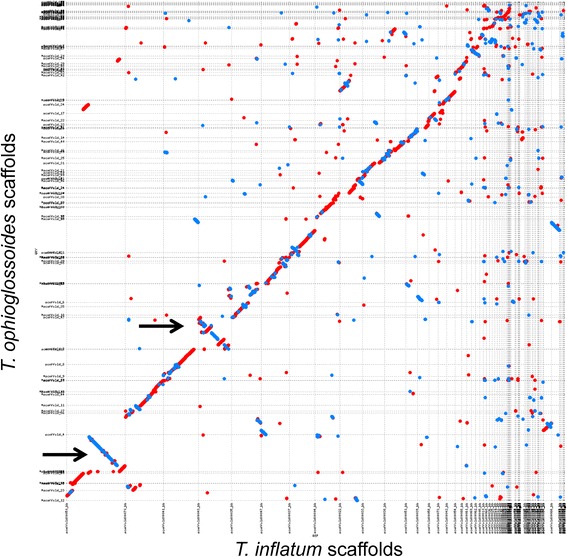
Whole genome nucleotide alignment of the Tolypocladium ophioglossoides and the T. inflatum genomes. Mummerplot visualization of nucmer alignment of all 172 unmasked T. ophioglossoides scaffolds against the reference 101 T. inflatum scaffolds. Red lines represent sequence aligning in the same direction while blue lines represent inversions. The black arrows point out the major inversions between the two genomes
