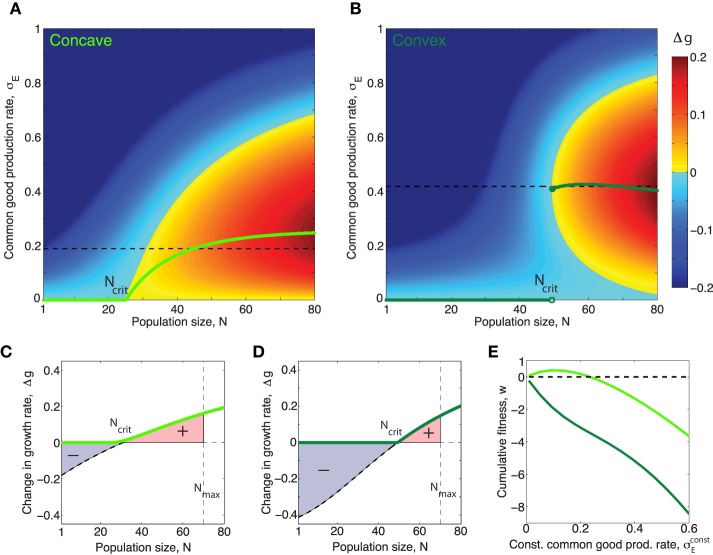
Figure 3.
Concave/convex benefit curves result in continuous/discontinuous optimal production curves respectively. (A,B) Green curves show optimal production rate of public good, as a function of population size, N for the concave/convex benefit functions shown in figure 1. The optimal value, , corresponds to the σE which maximizes Δg for N. The magnitude of Δg in the (N, σE)-space is shown by the colorbar. (A) In the case h = 1 the optimal production function is continuous and can be put in closed form: , where β = β1 + β2. The critical population size above which public good production is nonzero, when h = 1 is: . (B) When the benefit curve is convex, h = 2, the optimal production function is discontinuous. (C,D): Light/dark green curves show the effect on growth rate Δg for a population producing common good at exactly the optimal rate when the benefit curve is concave/convex respectively. Black dashed curves show the effect on growth rate Δg for a population producing common good at a constant rate , equal to the average of the non-zero part of the optimal curve, (shown as black dashed lines in (A,B). (E) The cumulative fitness, , where , (def. in Equation fitnessDef) of different constant production strategies for a common good with concave (light green) and convex (dark green) benefit functions respectively. Note that in the case of the “concave common good” there is a range of different constant production rates which allows the population to perform better than a nonproducing population w > 0, however for the “convex common good” any constant production strategy will leed to worse fitness than that of a nonproducing population, w < 0 for all . (In this figure σE is given in units of κ∕γE, which was set to one).

