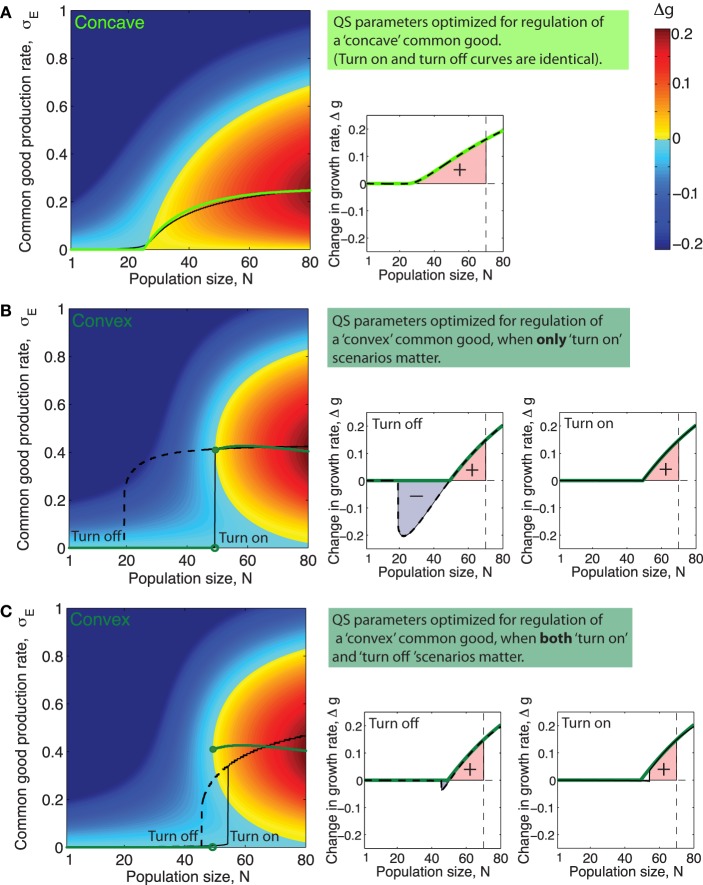
Figure 5.
Quorum sensing parameters optimized for different ecological scenarios and different types of public goods. (A–C) Left side panels: Green curves shows optimal production rate, , as a function of population size N. Black full line and dashed line show the production rate as a function of population size, N, when production is regulated by (A): a QS system with parameters such that cumulative fitness, w is optimized for a public good with the concave benefit function shown in Figure 1 (α = 1.1, KS = 2200, ), (B): a system with QS parameters for a public good with a convex benefit function maximizing cumulative fitness w in only “turn on” scenarios, (α = 2, KS = 980, and ), and (C): a QS system with parameters that maximize cumulative fitness w for a public good with a concave benefit function in both “turn on” and “turn off” scenarios, (α = 1.4, KS = 2600, and ). (A–C) Right side panels: Green lines show Δgopt, the increase in growth rate achieved, as a function of N when producing public good using the optimal production curve . Full black line shows Δg as a function of N for the QS regulated production curve marked “Turn on” in the plot to the right. Dashed black line shows Δg as a function of N for the QS regulated production curve marked “Turn off” in the plot to the left. The colored area underneath the Δg curves in the range N = [1, Nmax], (Nmax = 70) is proportional to the cumulative fitness, w (defined in Equations 7 and 8).

