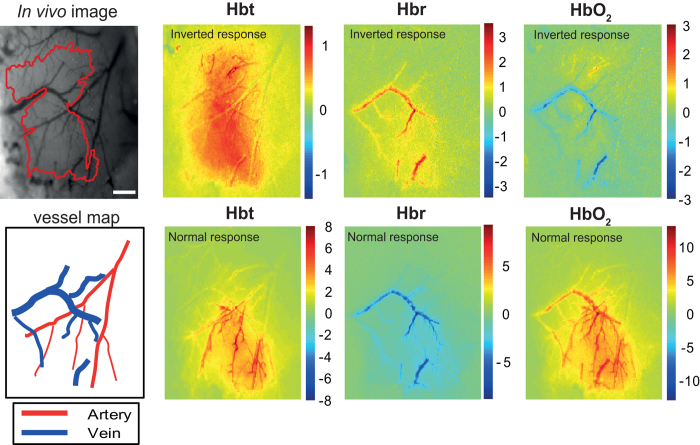
Figure 1. Spatial hemodynamic responses in the somatosensory cortex showing both inverted and ‘normal’ hemodynamics.
Upper left panel, grayscale image to show the surface vasculature overlying the somatosensory cortex under 575 nm illumination (scale bar = 250 μM). The ‘active whisker region’ (demarcated in red), are pixels within 50% of the peak z-score response. The illustrations (lower left panel) show the location of veins and arteries. The spatial images of trial-averaged changes in concentration (μM) of oxy- (HbO2), deoxy- (Hbr) and total (Hbt) hemoglobin are shown for a representative mouse. Scale bar represents z-score of activated pixels. Stimulus-evoked hemodynamic responses recorded within 4 h of anesthetic induction were inverted, with an increase in Hbt associated with increased Hbr and lack of arterial recruitment. After 4 h, ‘normal’ responses were observed, with a large increase in Hbt associated with increases in HbO2 and clear arterial activation.

