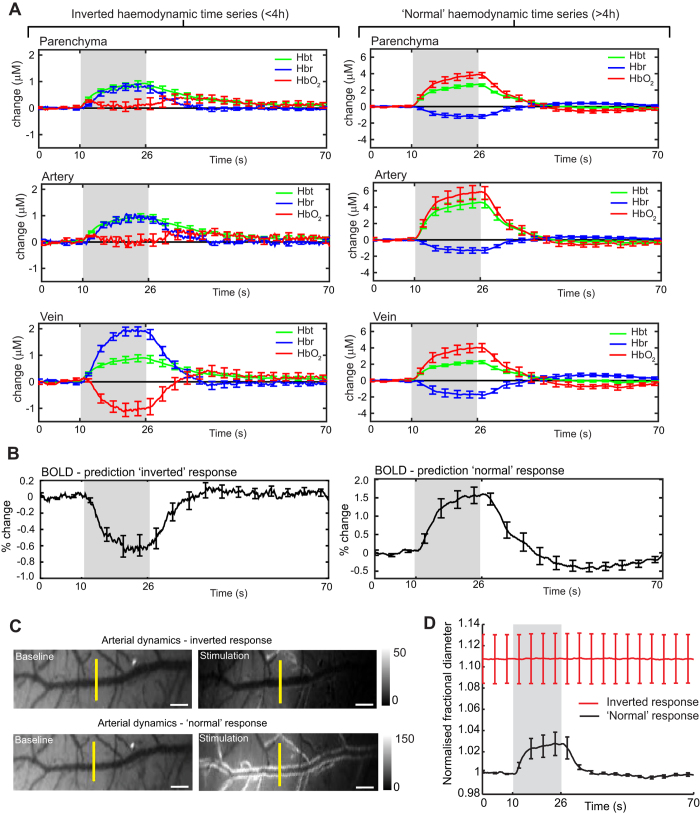
Figure 2. Hemodynamic time series in the anesthetized mouse.
(A) Averaged hemodynamic time series for inverted (n = 7) and ‘normal’ (n = 9) responses, selected from different vascular compartments within the ‘active whisker region’ (parenchyma, artery, vein). Gray boxes show the duration of whisker stimulation (16 s). (B) Predicted blood oxygen level-dependent (BOLD) functional magnetic resonance imaging (fMRI) response using the inverted (left) and ‘normal’ (right) parenchyma time series data as input to a biophysical model25,26. (C) Baseline images of an artery from a representative mouse averaged for 10 s prior to stimulus and averaged for stimulus-evoked changes. The images show the artery in the same mouse for both the inverted and ‘normal’ conditions (scale bars, 100 μM). The white borders along vessel edges indicate vasodilation. (D) Normalised time courses of arterial diameters (full-width half-maximum) in response to stimulation for both the inverted and ‘normal’ conditions. The yellow lines, indicate the location of the diameter measurements. Data shown as mean ± s.e.m.

