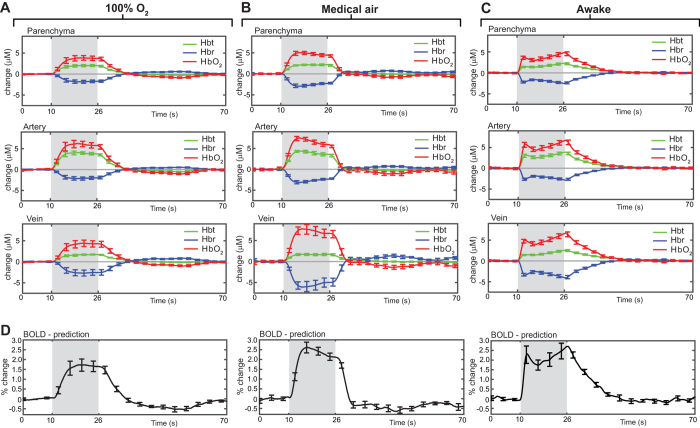
Figure 5. Comparing the hemodynamic response to whisker stimulation in anesthetized and awake mice.
(A) Averaged hemodynamic time series from regions of interest selected from different vascular compartments for anesthetized mice (n = 6) under 100% oxygen and the same mice (B), under medical air. (C) Averaged hemodynamic time series from a separate group of head fixed awake mice (n = 4). (D) Predicted blood oxygen level-dependent (BOLD) functional magnetic resonance imaging (fMRI) response for all three conditions, using parenchyma time series data as input to a biophysical model. All data shown as mean ± s.e.m.

