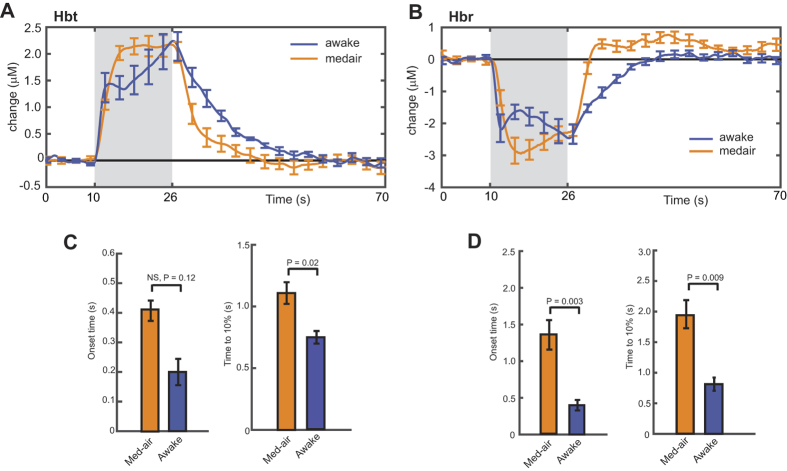
Figure 6. Temporal properties of the hemodynamic response to whisker stimulation in anesthetized and awake mice.
(A,B) Summary of averaged Hbt and Hbr time series for the parenchyma region from anesthetized and awake mice. (C,D) Onset of the hemodynamic response and time to 10% of the first peak is shown for Hbt and Hbr. A linear line fit to the initial rising slope was used for estimating the response onset. For statistical analysis, two tailed, unpaired t-test (anesthetized, n = 6, vs awake n = 4). Data shown as mean ± s.e.m.

