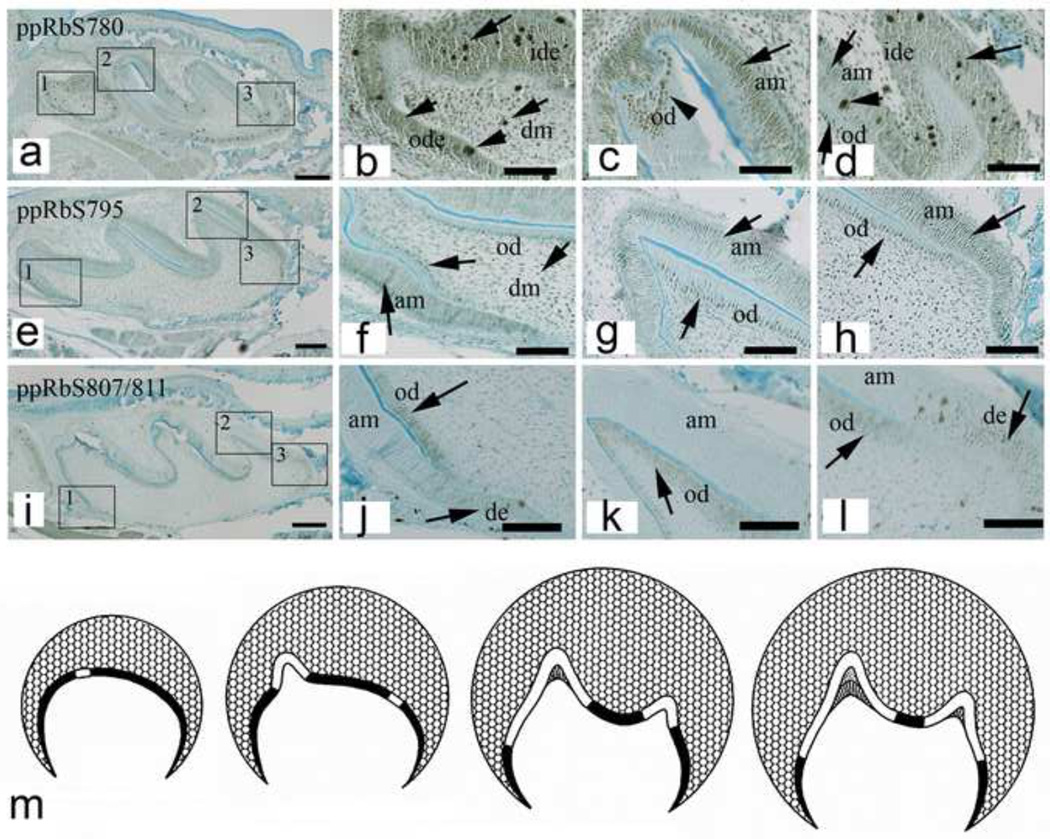
Figure 2. ppRb isoform expression in newborn (P1) mouse M1 molar teeth.
Individual ppRb isoforms exhibit discrete expression patterns in cusp and cervical loop regions of newborn M1 molar teeth (arrows). Boxes embedded in each left hand panels are shown enlarged in adjacent three right hand panels. The schematic molar tooth (m) indicates areas of dental epithelial cell proliferation (solid black areas), and non-proliferative zones (solid white areas). Abbreviations: am, ameloblast; de, dental epithelium; dm, dental mesenchyme; ide, inner dental epithelium; od, odontoblast; ode, outer dental epithelium. Scale bars indicate 100µm.

