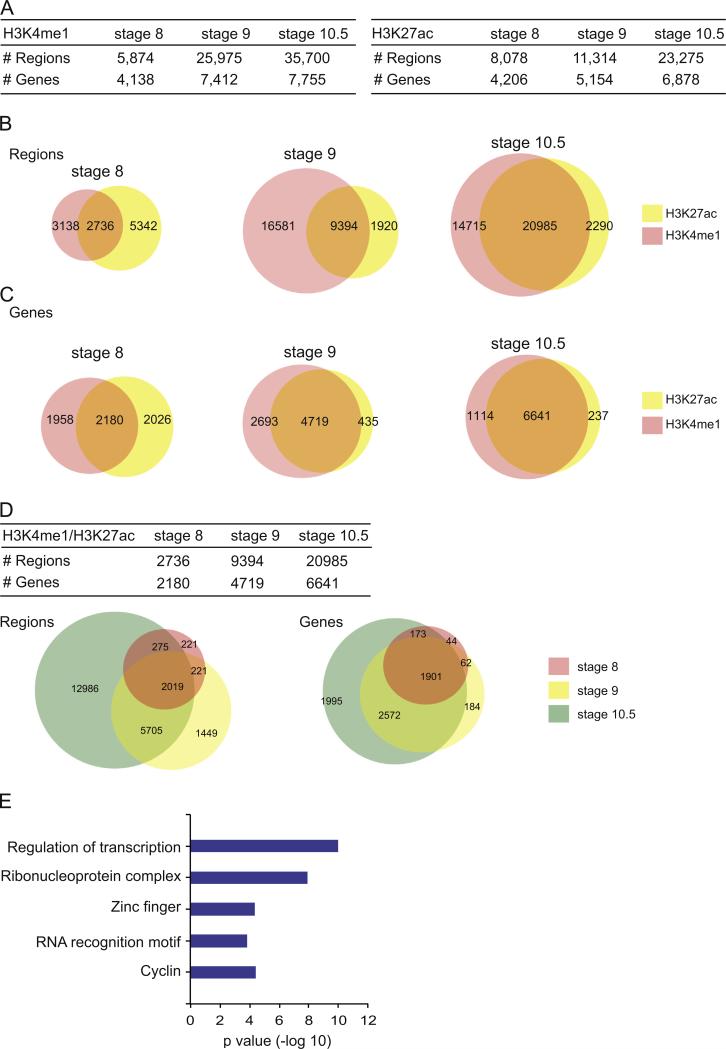
Fig. 2.
Occupancy of H3K27ac and H3K4me1 in X. tropicalis at stages 8, 9 and 10.5. (A) Table showing the breakdown of numbers from the ChIP-Seq datasets from H3K4me1 (left) and H3K27ac (right), including the number of regions identified and the genes that could be associated to the regions. Each category is depicted for stages 8, 9 and 10.5. (B) Venn diagrams showing overlap between regions bound by H3K27ac and H3K4me1 at stage 8, 9 and 10.5. (C) Venn diagrams showing overlap between the genes that can be associated with a region bound by H3K27ac and/or H3K4me1. (D) Table summarizing the number of regions bound by both H3K4me1 and H3K27ac and the associated genes at each stage. Venn diagrams depict the overlap of either the regions or associated genes. (E) DAVID analysis of genes associated to a region that is co-bound by H3K27ac and H3K4me1 at all stages (see intersection in Venn diagrams from (D)). X axis is the –log10 of p value for each term.

