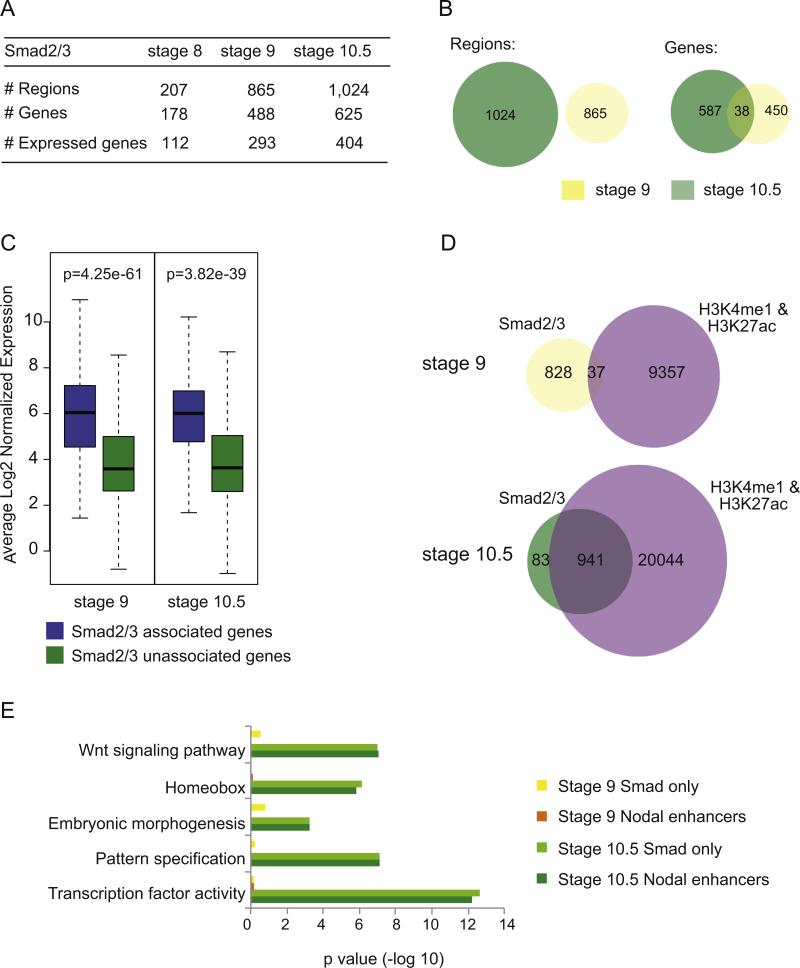
Fig. 3.
Identification of putative Nodal enhancers in blastula and gastrula. (A) Identification of regions bound by Smad2/3 and genes associated with these regions at stage 8, 9 and 10.5. The number of genes associated with Smad2/3 bound regions is further classified into those whose expression was detected by 3SEQ. (B) Venn diagrams comparing regions bound by Smad2/3 at stages 9 and 10.5 (left) and the genes that are associated to Smad2/3 binding at stages 9 and 10.5 (right). (C) Box plot representation of transcript abundance of genes associated with a Smad2/3 bound region (blue) and those that are not associated with a Smad2/3 bound region (green) at stage 9 (293 expressed genes associated with Smad2/3 binding vs. 6555 not associated) and stage 10.5 (404 genes vs. 6645 not associated). (D) Venn diagrams demonstrating the overlap between regions bound by Smad2/3 and regions bound by both H3K4me1 and H3K27ac at stages 9 and 10.5. (E) DAVID analysis of genes associated with Smad2/3, H3K4me1 and H3K27ac bound regions (Nodal enhancers) at stage 9 (orange), stage 10.5 (dark green) and genes associated only with Smad2/3 bound regions at stage 9 (yellow) and stage 10.5 (light green).

