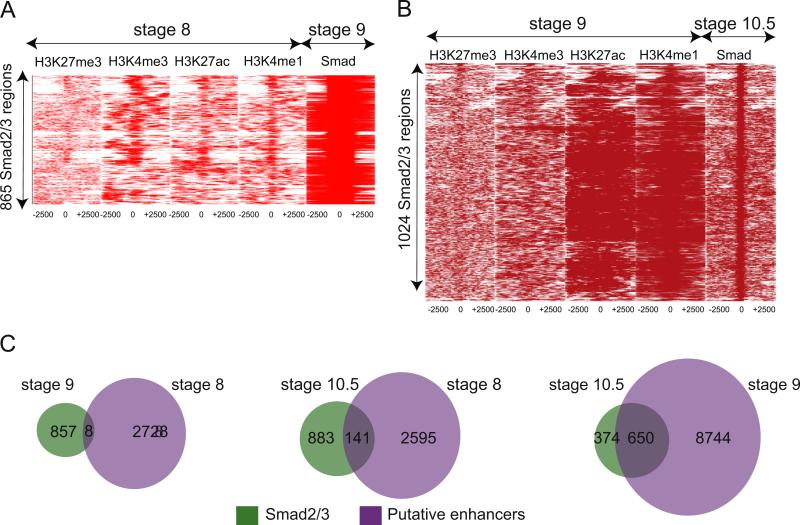
Fig. 5.
Deposition of enhancer marks precedes Smad2/3 binding. (A) Heat maps depicting binding intensities of H3K27me3, H3K4me3, H3K27ac, H3K4me1 at stage 8 (first four panels) at 5 kb region surrounding where Smad2/3 will bind at stage 9 (last panel). At stage 9, Smad2/3 occupies 865 regions, which is the Y axis. All regions are centered around Smad2/3 binding, with 2.5 kb on either side (X axis). (B) Heat maps depicting binding intensities of H3K27me3, H3K4me3, H3K27ac, and H3K4me1 at stage 9 (first four panels) at 5 kb region surrounding where Smad2/3 will bind at stage 10.5 (last panel). At stage 10.5, Smad2/3 occupies 1024 regions (Y axis). All regions are centered around Smad2/3 occupancy, with 2.5 kb on either side (X axis). (C) Venn diagrams depicting how H3K4me1 and H3K27ac present at stage 8 and stage 9 predict Smad2/3 association at stage 10.5. Left: comparison of stage 9 Smad2/3 bound regions with stage 8 putative enhancers. Middle: comparison of stage 10.5 Smad2/3 bound regions with stage 8 putative enhancers. Right: comparison of stage 10.5 Smad2/3 bound regions with stage 9 putative enhancers.

