Fig. 6.
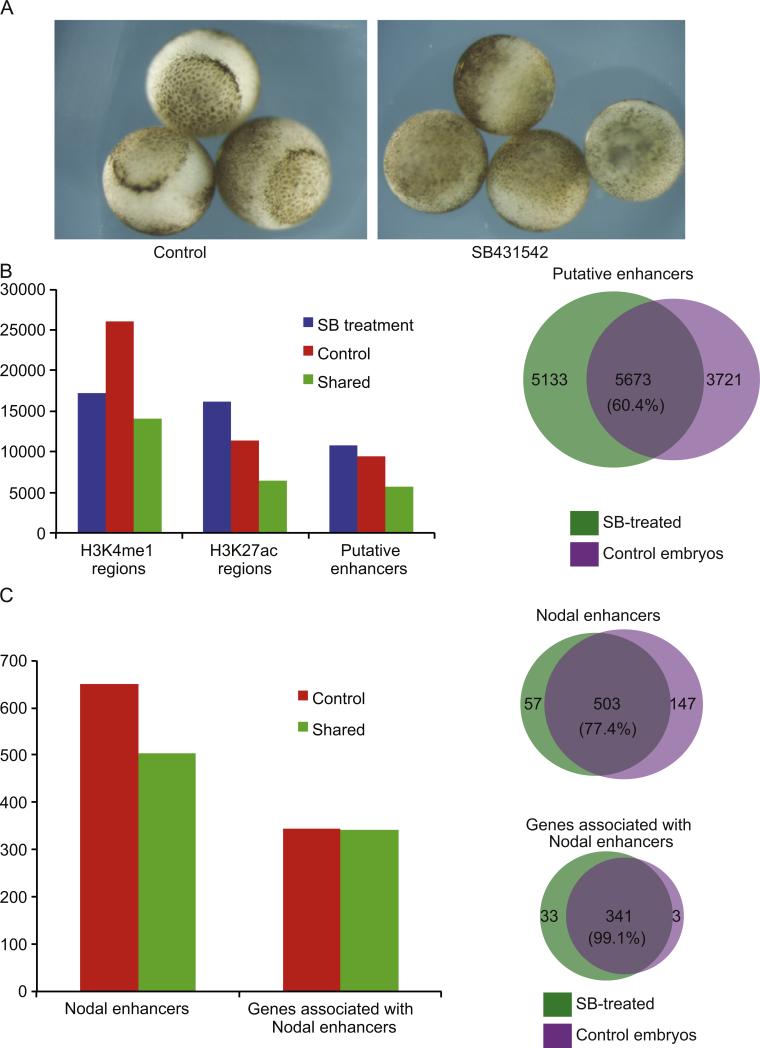
Blocking Nodal signaling does not compromise H3K4me1/H3K27ac positioning. (A) Control embryos (left) or SB431542-treated embryos (right) showing the failure of blastopore formation after inhibition of Nodal signaling at stage 10.5. (B) Left: bar graph representing the number of regions marked by H3K4me1, H3K27ac, or both marks (putative enhancers) at stage 9, in either control embryos, SB431542-treated embryos, or both conditions (“Shared”); right: Venn diagram depicting the overlap of putative enhancers in Control and SB431542-treated embryos at stage 9. Percentage of enhancers that are shared is shown in the center. (C) Left: bar graph representing the number of putative enhancers at stage 9 that will acquire Smad2/3 binding at stage 10.5 (Nodal enhancers) in control embryos alone (“Control”) or both control and SB431542 treated embryos (“Shared”). Nodal enhancer regions and associated genes are both shown; right: Venn diagram showing the overlap of Nodal enhancers (top) and associated genes (bottom) in control and SB431542 treated embryos. The percentage of shared enhancers and genes is shown in the center of each diagram.

