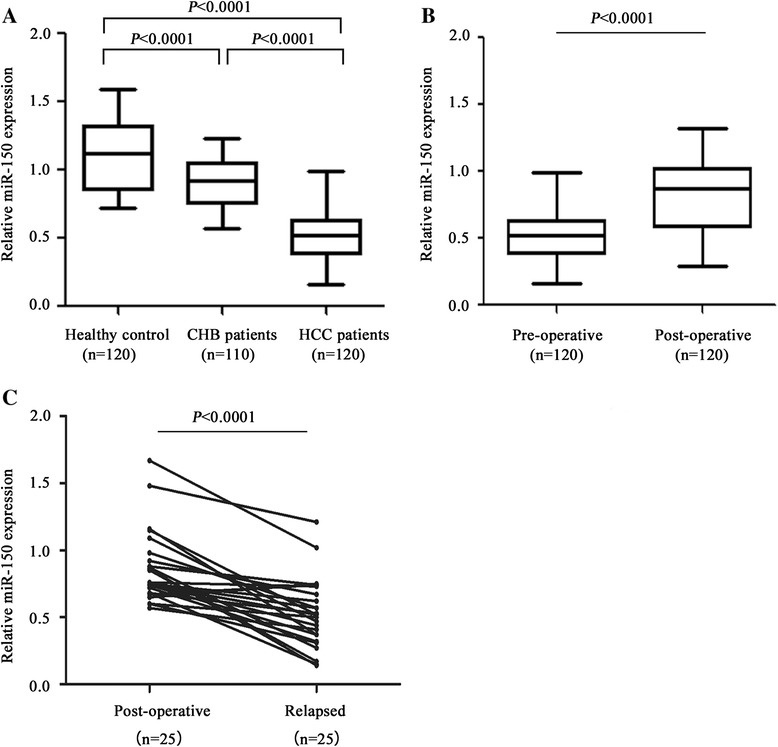
Fig. 1.

Serum miR-150 levels in healthy controls (n = 120), CHB patients (n = 110), HCC patients including pre-operative and post-operative (n = 120), and relapsed patients (n = 25). a Comparison of miR-150 levels among the healthy control, CHB group, and HCC group (pre-operative). b Comparison of miR-150 levels between pre-operative group and post-operative group. c Comparison of miR-150 levels between paired post-operative and relapsed serums. The lines represent the range and median of relative miR-150 expression
